JOHNSON CONTROLS
122
FORM 160.67-O1
ISSUE DATE: 4/1/2015
SECTION 2 - OPTIVIEW CONTROL CENTER INTRODUCTION
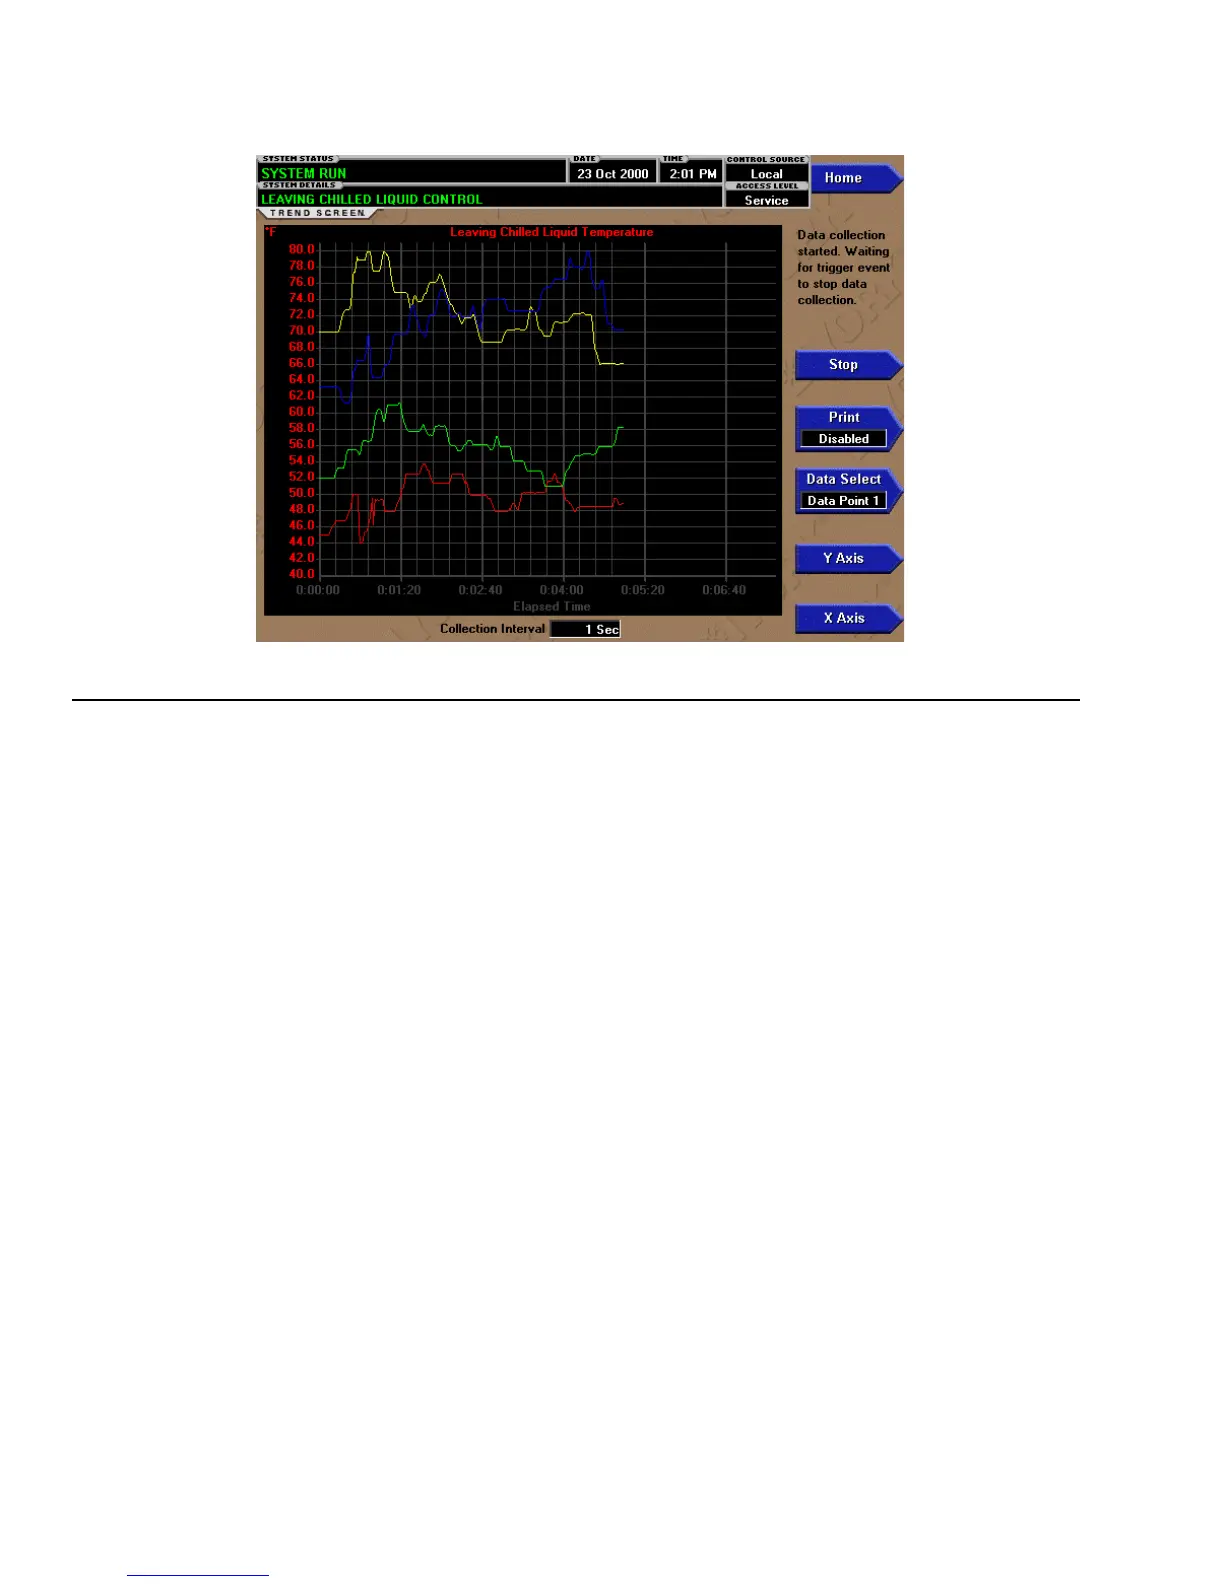
TREND SCREEN
00472VIP
FIGURE 50 - TREND SCREEN
NOTE: OptiView
™
Control Center Screens shown may NOT represent the exact screens according to the software version utilized.
OVERVIEW
As many as six Operator selected parameters (Data
Points) can be plotted in an X/Y graph format. The
X-Axis is scaled per the selected Data Collection In-
terval and displayed in a time of day or elapsed time
format, as selected with the X-axis toggle key. The
Y-Axis is scaled for each parameter per the selected
minimum and maximum value for each parameter.
Analog parameters are scaled in pressure, temperature,
volts, amps, hertz or time. Digital on/off parameters
are scaled as zero (off) and one (on). Only one Y-Axis
label is displayed at a time. The Y-Axis Toggle Key is
used to toggle the Y-Axis labels through the different
parameters. The Y-Axis label that is being displayed
is identified at the top of the graph. For identification,
each plotted parameter and associated Y-Axis labeling
is color coordinated.
The DATA SELECT key is used to display all trend-
ed Data Points simultaneously or select a single Data
Point for display.
The parameters are sampled at the selected Data Col-
lection Interval and plotted using 450 data points across
the X-Axis. If the actual value of the sampled param-
eter is less than the Y-Axis label minimum for that
parameter, the value will be plotted at the minimum
value. Similarly, if the actual value is greater than the
Y-Axis label maximum for that parameter, the value
will be plotted at the maximum value.
There are three types of charts that can be created:
ONE SCREEN, CONTINUOUS or TRIGGERED.
When plotting reaches the end of the X-axis, if ONE
SCREEN is selected, trending stops and data is fro-
zen. If CONTINUOUS is selected, the oldest data is
dropped from the left-hand side of the graph at the
next collection interval. Thereafter, the oldest data is
dropped from the left hand-side of the graph at each
data collection interval. If TRIGGERED is selected,
data collection can be set to start or stop based upon
the selected TRIGGER ACTION (START or STOP).
If START is selected, data collection will not begin
until the Triggers have been satisfied and any selected
TRIGGER DELAY has elapsed. Data collection will
stop at the completion of one screen of data as with
the ONE SCREEN. If STOP is selected, data collection
will not stop until the Triggers have been satisfied and
any selected TRIGGER DELAY has elapsed.
If a power failure occurs while the trending is running,
the trending is stopped. Upon restoration of power,
the last screen of data that was collected will be dis-
played on the trending screen. The START key must be
pressed to initiate a new trend screen.
DISPLAY ONLY
This screen allows the user to view the graphical trend-
ing of the selected parameters and is also a gateway to
the graph setup screens.

 Loading...