| Description of the individual apps of the eMShome – Dashboard
26
Description of the individual apps of the eMShome
The dashboard of the eMShome web interface (see below) provides basic information about the system and allows
access to individual apps at any time. These are described in more detail in the following sections.
Dashboard
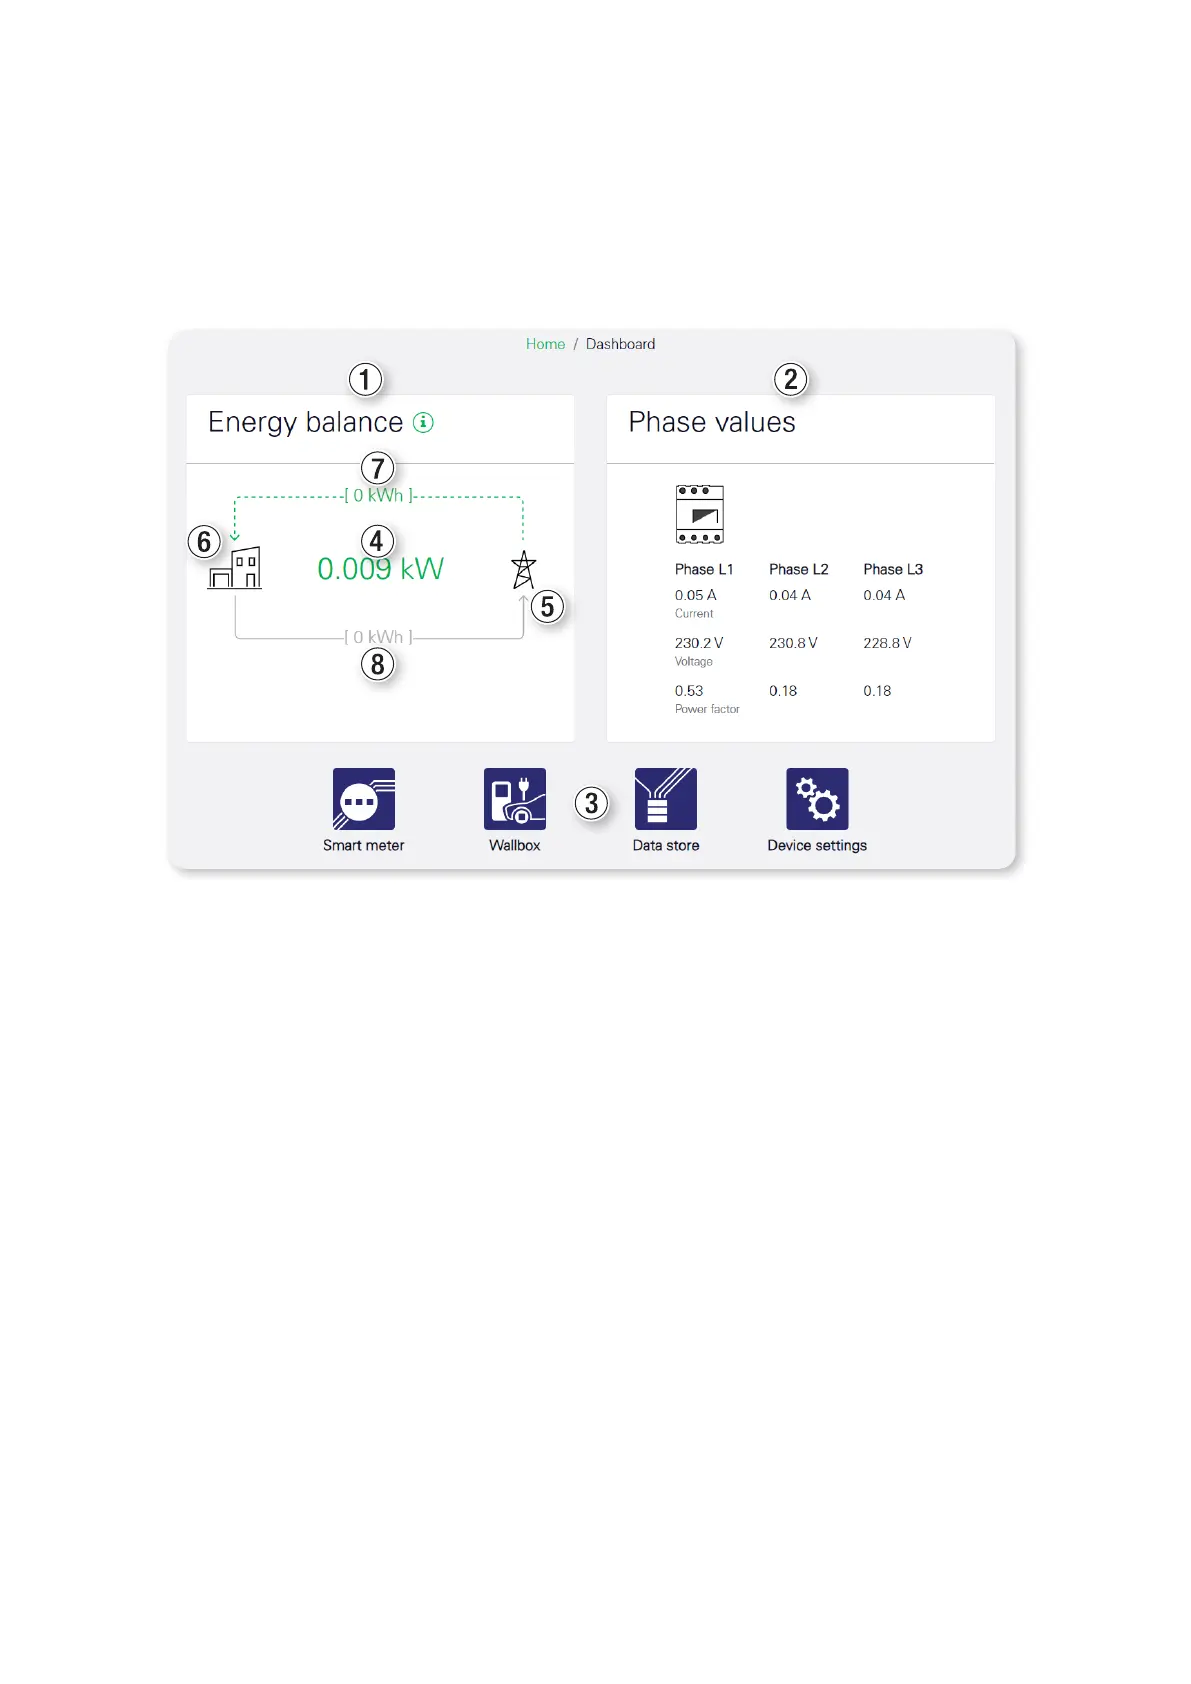
The dashboard contains the Energy balance1 and Phase values2 widgets.
The value 4 displayed centrally in the Energy balance widget shows the current active power in kW.
The arrows indicate whether the entire system is drawing power or feeding it into the electricity grid: the upper
arrow represents the power being drawn, while the lower arrow represents the power being fed in.
The current state is indicated by a green, dashed arrow: in the illustration above, the system is currently drawing
power from the grid6.
The inactive state is represented by a grey, solid arrow5.
The upper value on the arrow7 shows the meter reading for the drawn power (active energy in kWh) over the
entire operating time. The lower value8 indicates the meter reading for the power fed in (active energy in kWh)
over the entire operating time.
The Phase values widget on the right shows the current measured values for the current, voltage, and power
factor for all three outer conductors (L1, L2, L3).
The lower section3 lists the other available apps, which can be accessed via these buttons and via the sidebar at
the touch of a button.
 Loading...