Description of the individual apps of the eMShome – Smart Meter app |
29
Smart Meter app
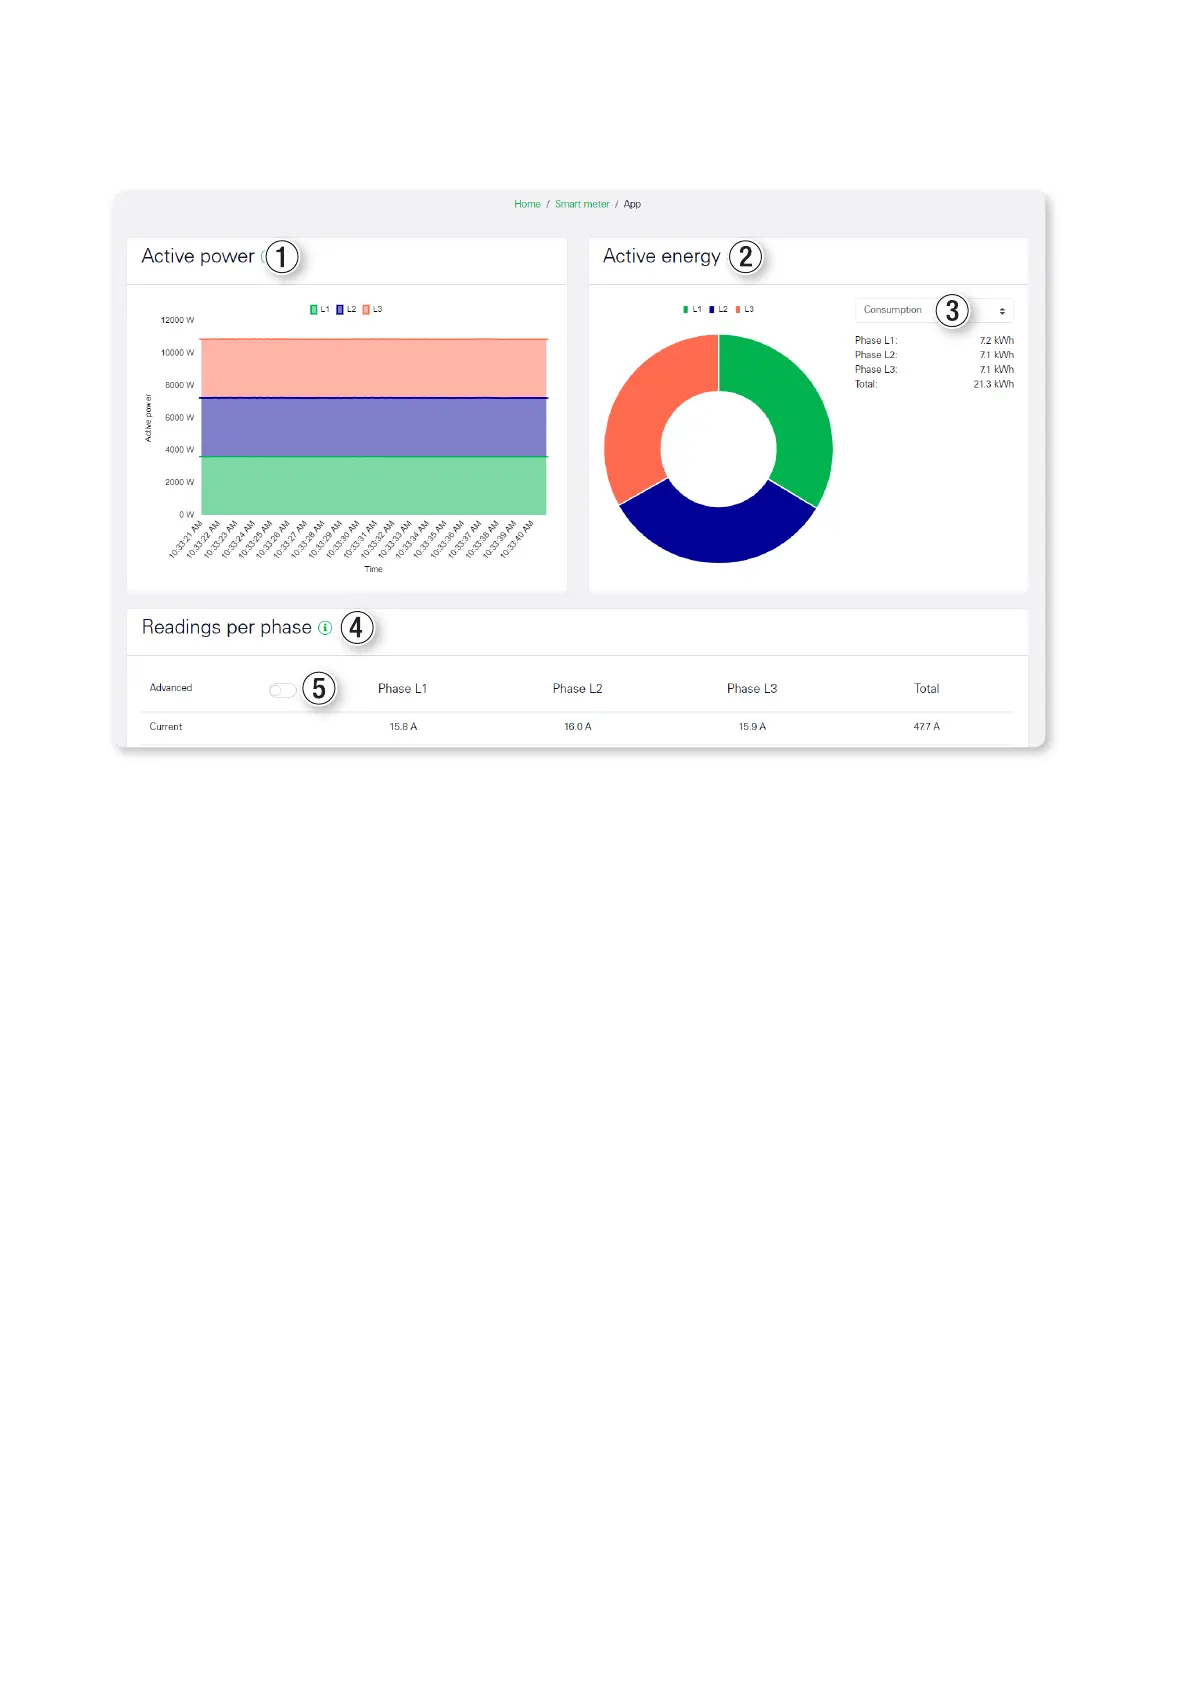
The line diagram shown in the Active power1 widget shows a short-term trend of the total active power over the
three individual phases. The power values displayed in the app are marked with a (+) when drawing power and a (-)
when feeding in power.
The Active energy2 widget shows the ratio of active energy between the three phases. The drop-down list3 can
be used to switch between the Consumption and Feed-in display.
The table in the Readings per phase4 widget shows all the physical quantities recorded by the system for the en-
tire system and individually per phase. All power and energy values are shown separately as draw (+) and feed (-).
The Advanced5 switch displays the values for reactive and apparent power, as well as reactive and apparent
energy.
 Loading...