AEQ Audio Over IP
Routing System
39
Clock Status Monitoring: Activates the Clock Status Monitoring function. For more
information, check section 4.7.4.3.
Channel Groups: Allows the activation of the display of audio channels for each device in
groups of 16. For more information, check section 4.7.4.1.
To the right of the toolbar, "Dante Controller" displays the current master clock (or clocks, in the
case of redundant networks).
Domain Configuration: allows you to connect to a DDM server. For more information,
check section 4.10.1.
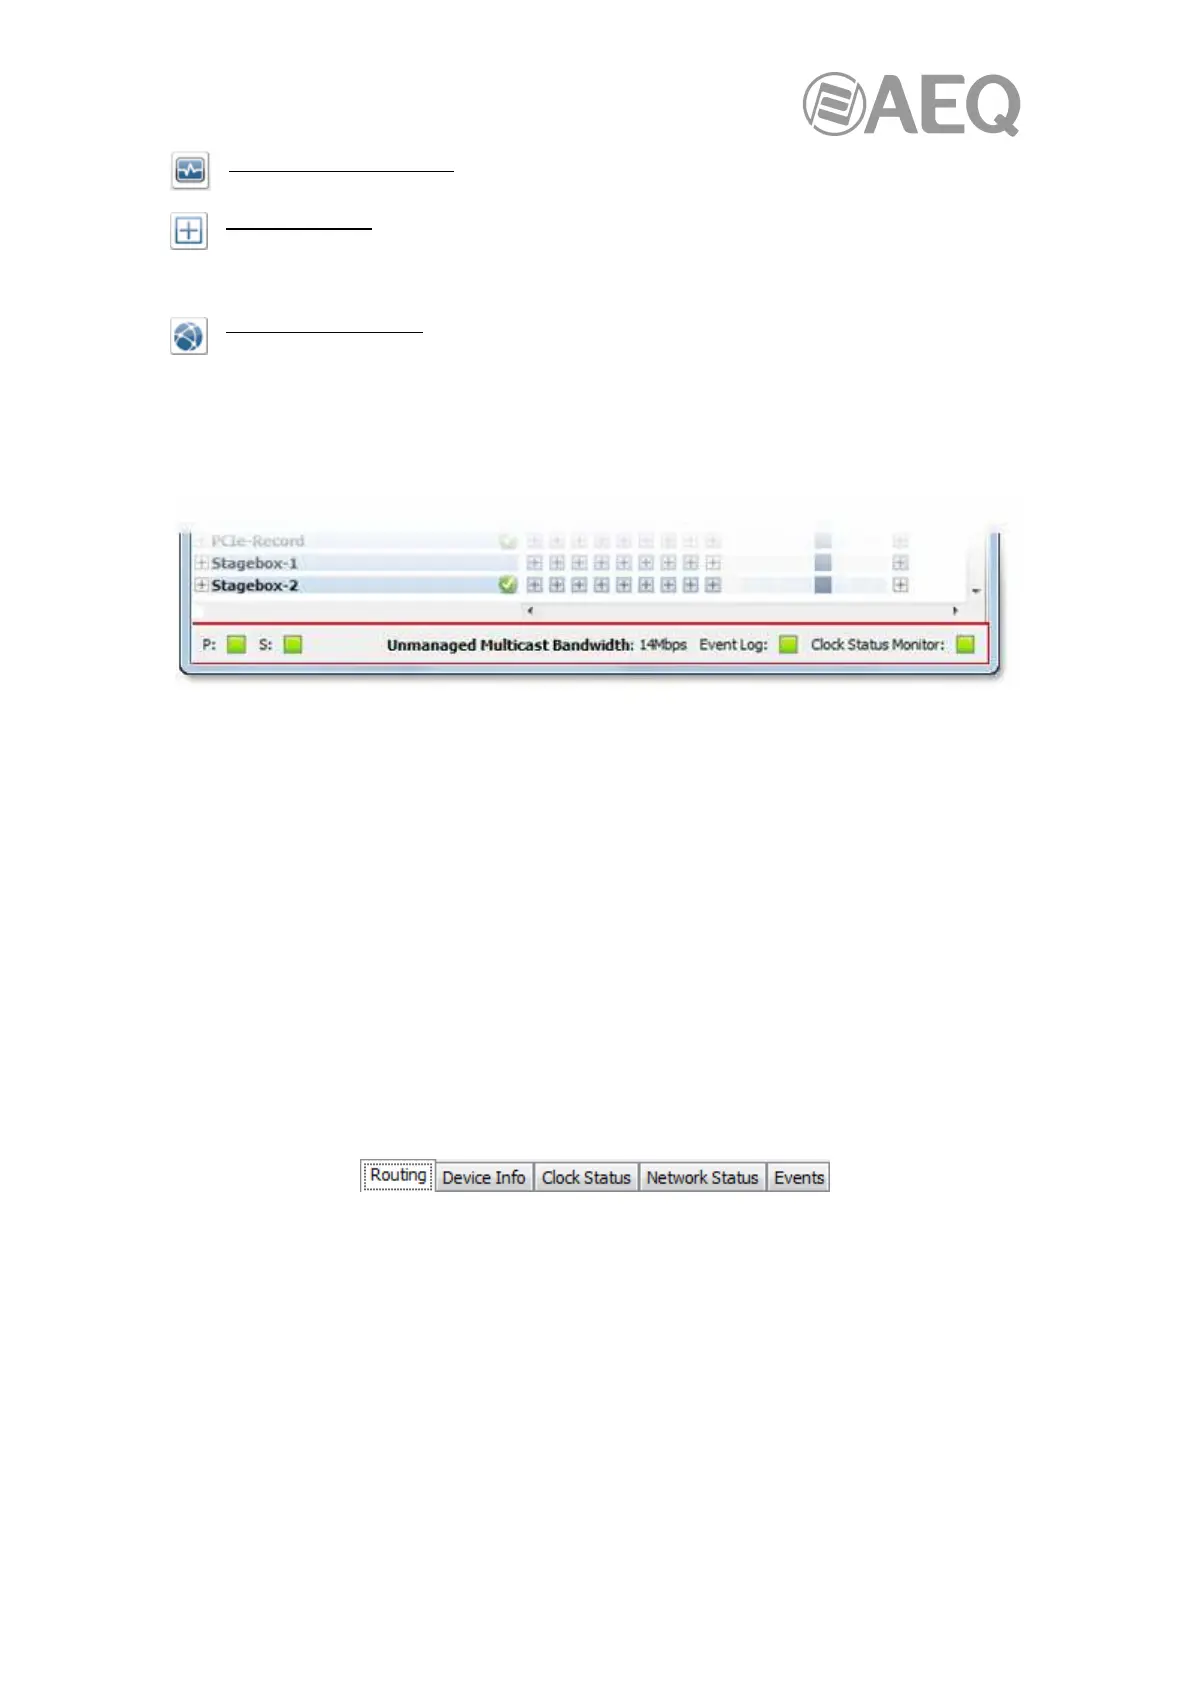
4.7.3. "Network View" Status Bar.
The Status Bar, in the bottom area of the screen, displays notifications for network status,
general device events, and clock status events, plus the current Dante audio multicast
bandwidth on the network.
The Status Bar displays the following information:
- P: The current status of the Primary network. Green indicates that "Dante Controller" is
currently connected to the primary Dante network. Red indicates a problem with the
connection.
- S: The current status of the Secondary Dante network. Only displayed where a
secondary network is connected.
- Unmanaged Multicast Bandwidth: The current Dante audio multicast bandwidth on
the connected networks. Note that there may be network traffic from other sources that
is not included in the multicast bandwidth reading.
- Event Log: Indicates the current status of the event log. Click the icon to open the
Events View.
- Clock Status Monitor: Indicates the current status of the Clock Status Monitor. Click
the icon to open the Clock Status Monitor.
4.7.4. "Network View" Tabs.
There are five sub-views within "Network View" that can be selected by clicking on the tabs
located under the tool bar:
Each of these options is described below.
4.7.4.1. "Routing".
When "Dante Controller" is started, it always displays the Routing Tab within the Network View.
In this view the network is shown in the form of a grid. Devices with Tx channels are displayed
along the top row of the grid, and those with Rx channels are displayed along the left-hand
column of the grid. Initially a collapsed view is presented; individual channels cannot be seen.
NOTE: If a device name is shown in red, it means "Dante Controller" has automatically detected
an error condition. Double-click the device name to see more information. For more information,
check section 4.7.5.
 Loading...