314
Chapter 7 Tutorial
Frequency Sweep
7
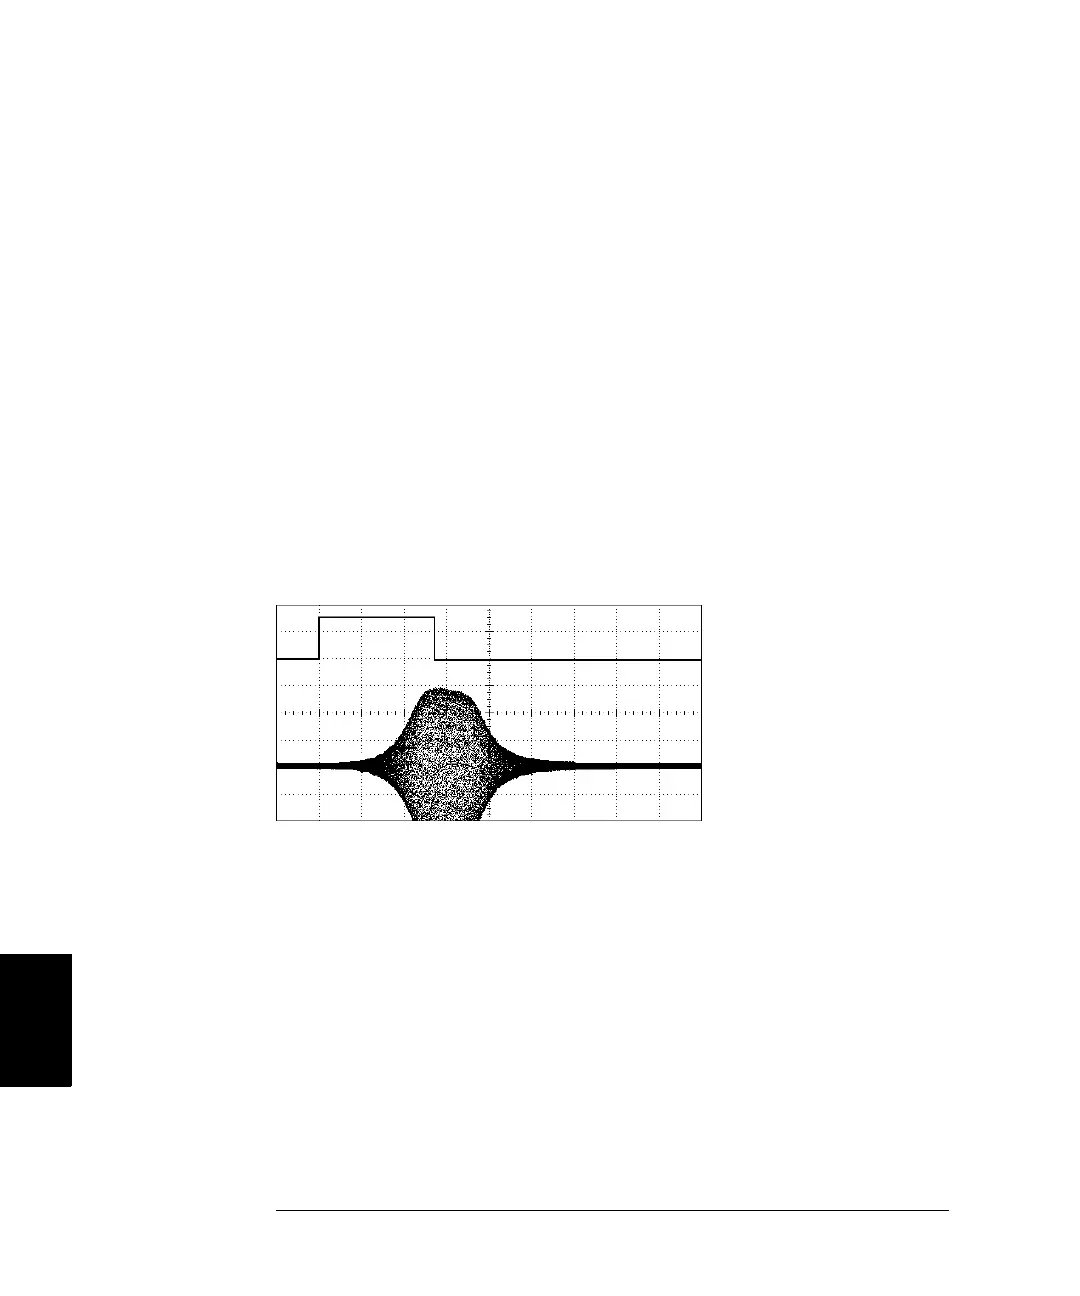
Sync and Marker Signals The output from the front-panel Sync
connector goes “high” at the beginning of each sweep. If you have disabled
the Marker function, the Sync signal goes “low” at the midpoint of the
sweep. However, if you have enabled the Marker function, the Sync
signal goes “low” when the output frequency reaches the specified
marker frequency. The marker frequency must be between the specified
start frequency and stop frequency.
You can use the Marker function to identify a notable frequency in the
response of a device under test (DUT) – for example, you may want to
identify a resonance. To do this
, connect the Sync output to one channel
of your oscilloscope and connect the DUT output to another channel.
Then, trigger the oscilloscope with the rising edge of the Sync signal to
position the start frequency on the left side of the screen. Adjust the
marker frequency until the falling edge of the Sync signal lines up with
the interesting feature in the device’s
response. You can then read the
frequency from the front-panel display
of the 33250A.
Sweep with Marker at DUT Resonance
Sync Output
DUT Output