Option 100 Fault Location and SRL 9-9
Characteristics
SRL Measurement Uncertainty vs Connector Fault
2. Compute the sum and difference responses (assume the responses
may have a plus or minus phase).
3. Convert from linear to log (dB) using the following equation:
dB = (20)(Log
10
)(Reflection Coefficient)
Example:
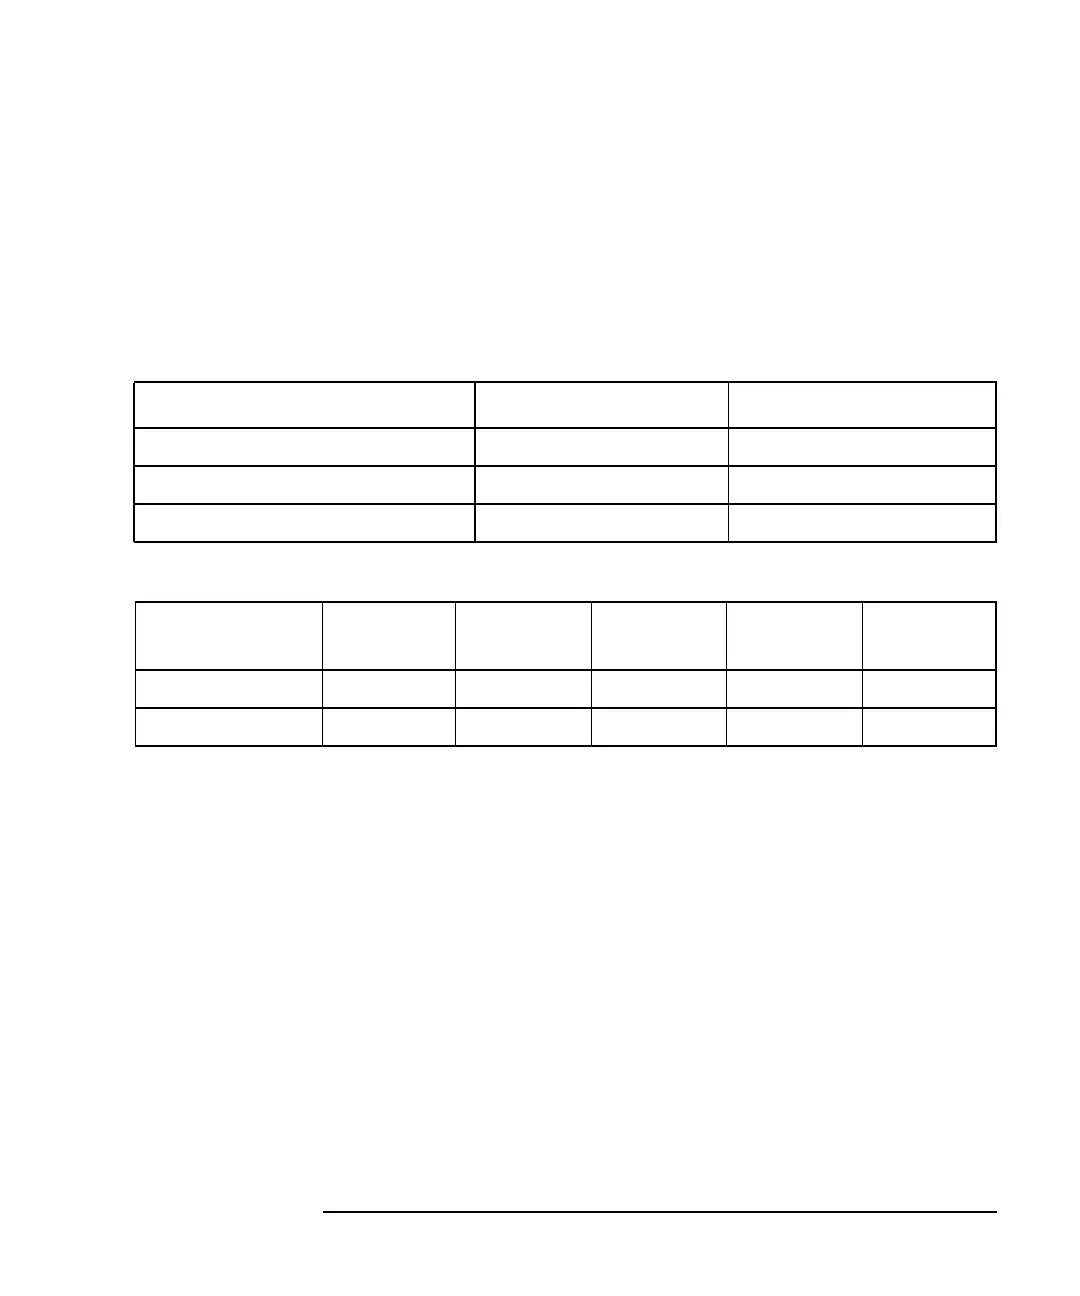
Table 9-4 Uncertainty Worksheet 1
Table 9-5 Uncertainty Worksheet 2
Measurement uncertainty = −32 dB +2.03/−2.7 dB
Measurement Uncertainty Tables
The following tables show the relationship between the corrected
connector fault response, industry standard SRL cable specifications,
and the maximum and minimum measured SRL responses. The tables
also take into account the affects of system directivity (which can be
determined from the trace with a load connected after calibration).
Measurement Log (dB) Refl. Coef. (Linear)
SRL Response −32 dB 0.0251
Connector Response −50 dB 0.00316
System Directivity −49 dB 0.00354
Operation
SRL
Response
Connector
Response
System
Directivity
Result
(Linear)
Result (dB)
Max (add) 0.0251 0.00316 0.00354 0.0318 −29.97
Min (subtract) 0.0251 0.00316 0.00354 0.0184 −34.70

 Loading...