3-10 Option 100 Fault Location and SRL
Making Fault Location Measurements
How to Make and Interpret Fault Location Measurements
5. Interpret the Measurement
Once the measurement parameters have been set up, you can use
markers to find the peak responses (which indicate faults or
discontinuities), or you can place a test limit line on the screen that will
indicate whether or not your cable meets a particular specification.
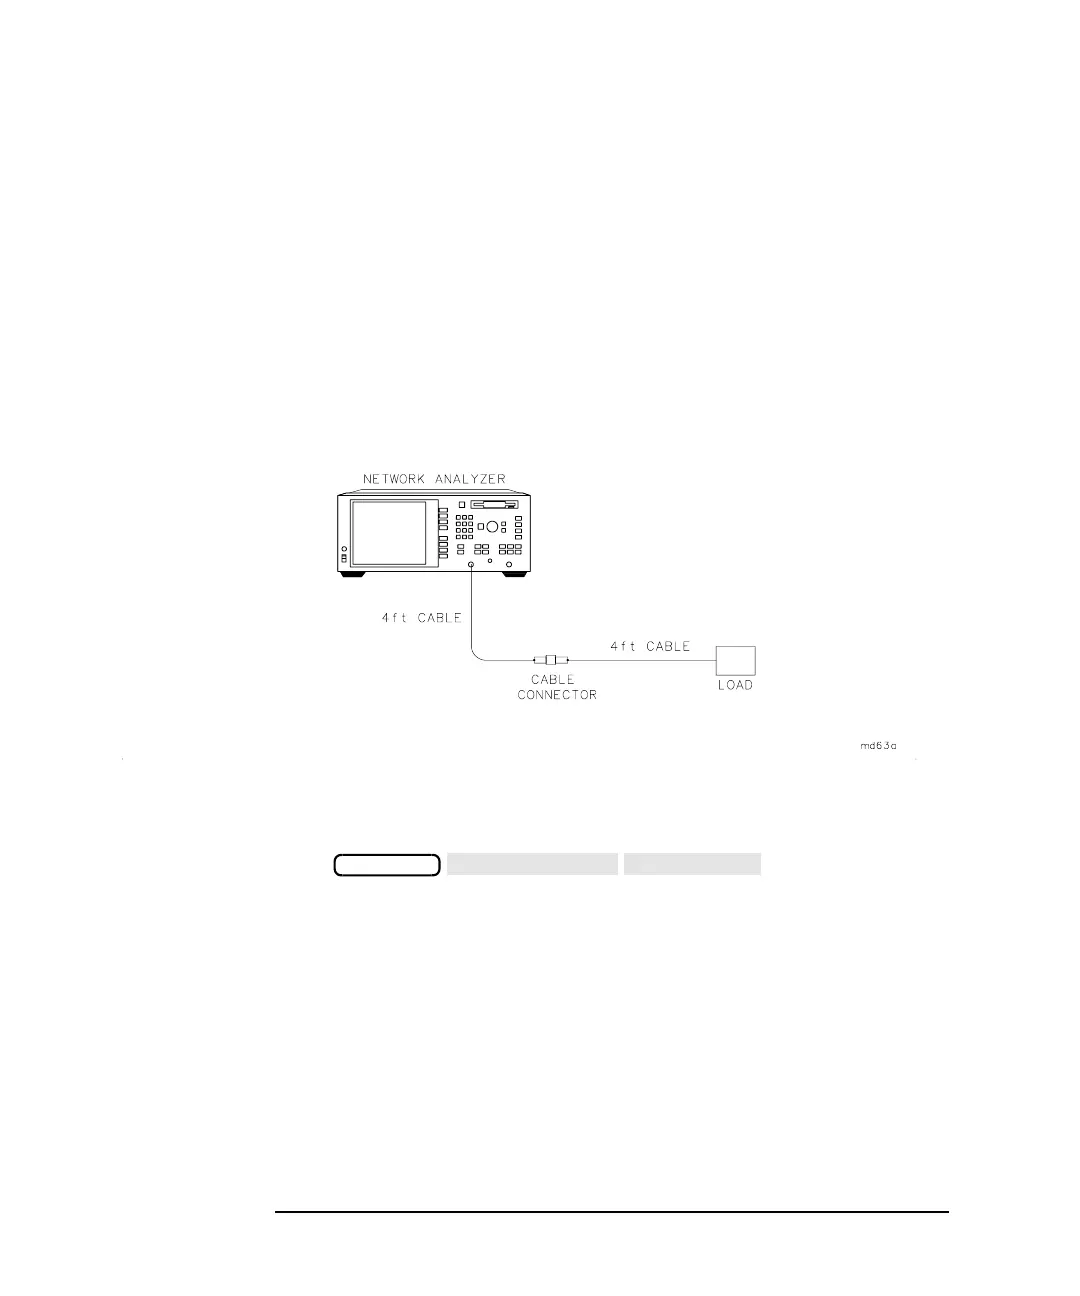
In the following example, two four-foot cables are connected in series to
the RF OUT (or PORT 1) test port of the analyzer and are terminated
with a 50 ohm load. See Figure 3-3.
Figure 3-3 Equipment Setup
Using Markers to Find Peak Responses
Press .
Marker number 1 will automatically be placed on the peak with the
highest response. Refer to Figure 3-4. Notice that the display indicates
that the response marked by marker number 1 is 4.000 feet from the
RF OUT (or PORT 1) test port, and has a return loss of −28.39 dB.
Knowing that we connected two four-foot cables together for this
example, it can be determined that this discontinuity is created by the
connection between the two cables.
MARKER