3-18 Option 100 Fault Location and SRL
Making Fault Location Measurements
Example Fault Location Measurements
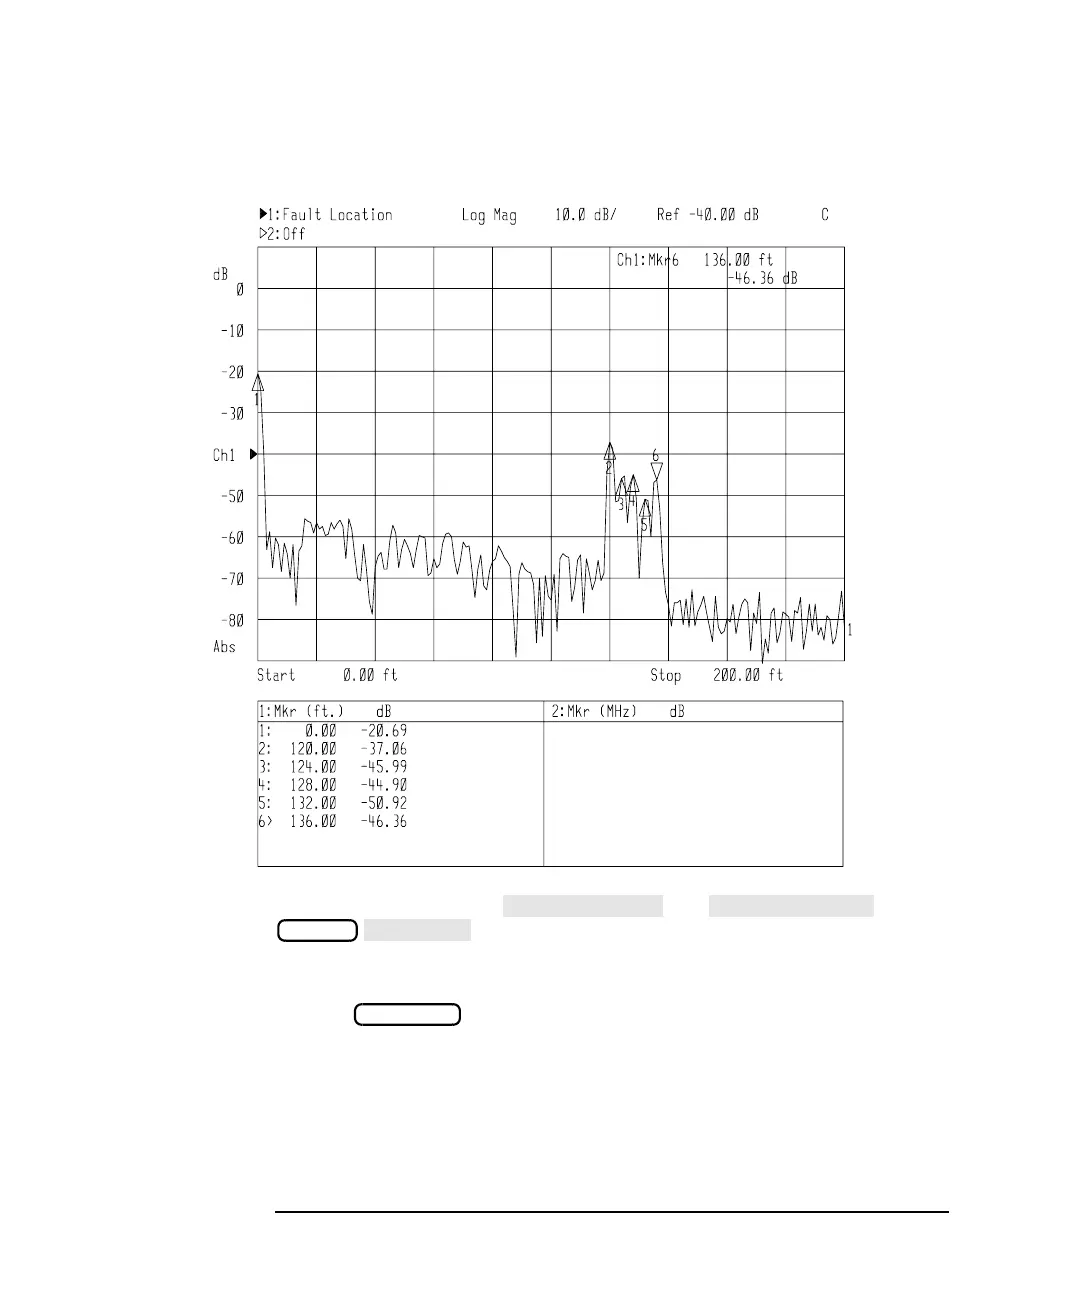
Figure 3-10 Example 3: Identify Mismatches at Greater Distance
You can now change the and (in the
menu) to zoom in around the responses marked by
markers 2 through 6. See Figure 3-11. (The marker table only appears on
plots.)
Use the menu to place markers 1 through 5 on the peak
responses. Marker 1 is the first connector. Marker 5 identifies the 50 ohm
termination.
MENU
MARKER