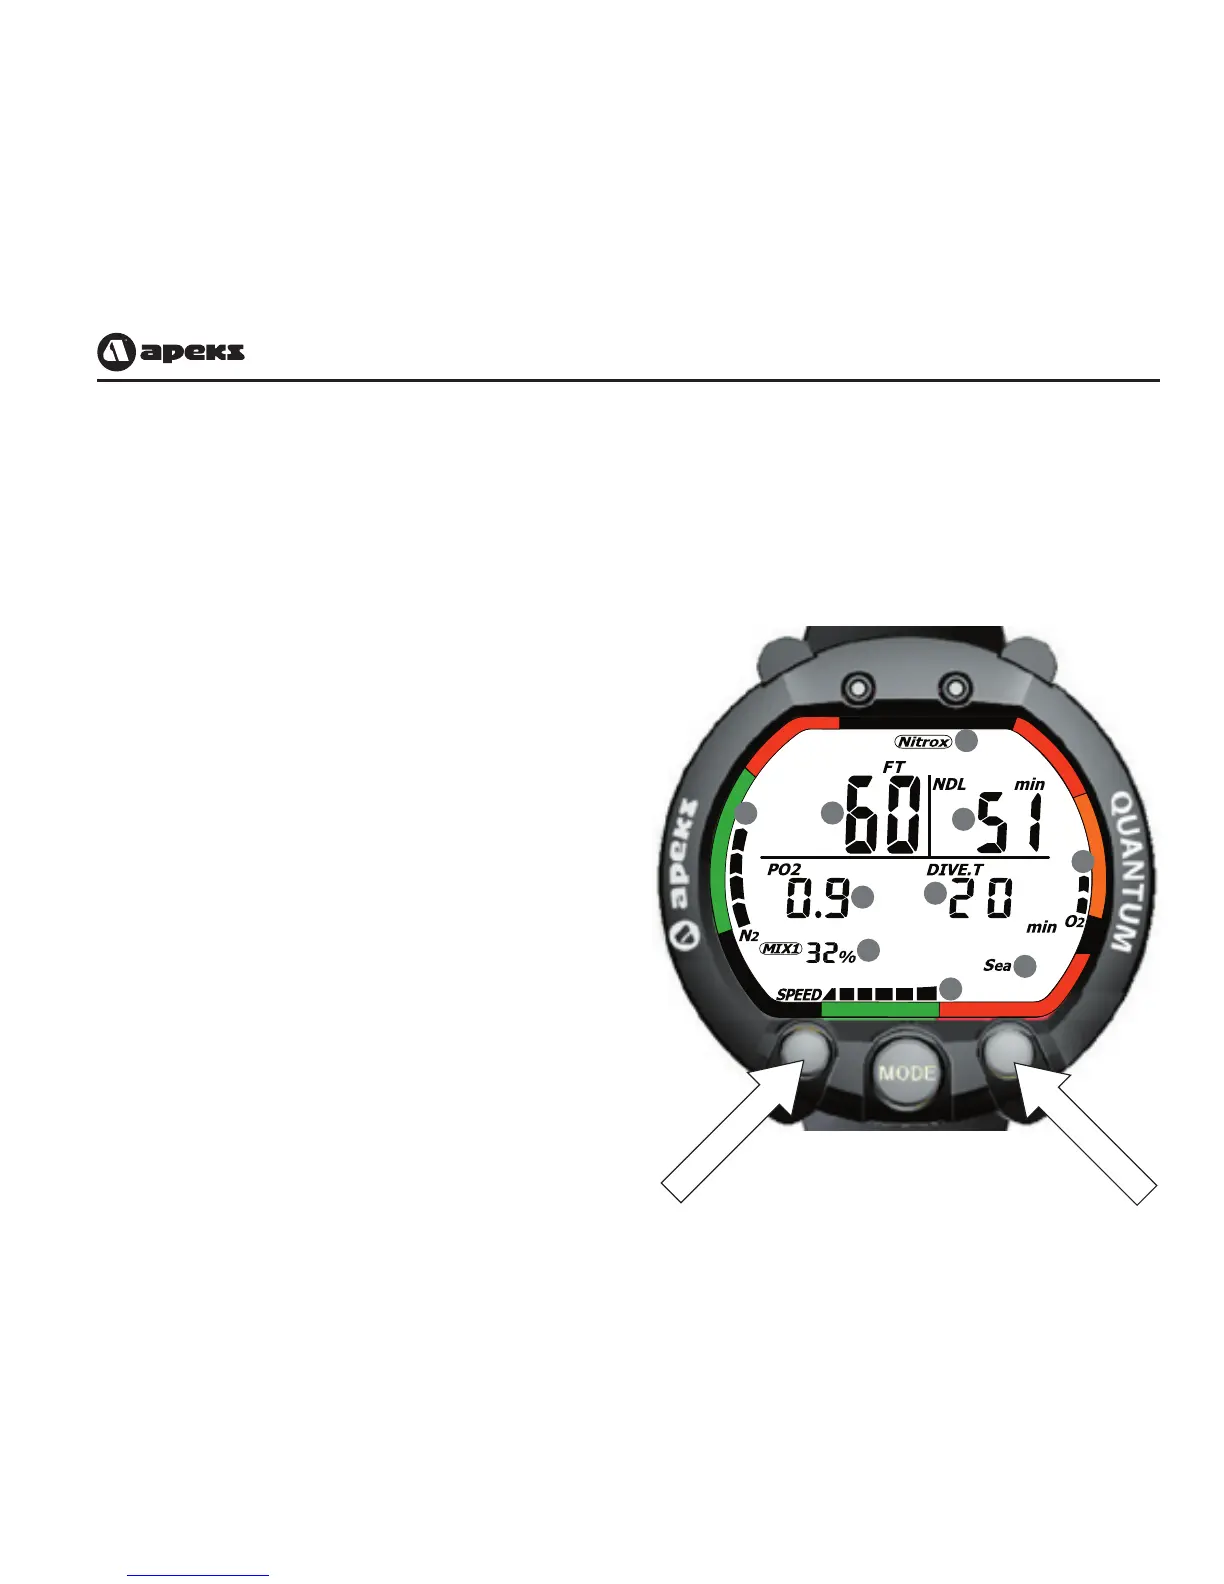
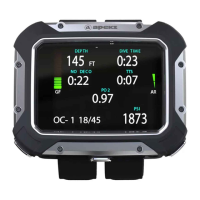
e. MIX indicator: Which mix is currently being used.
f. Ascent Rate: Graphically shows your ascent speed.
g. Nitrogen Bar Graph: Graphically shows your body absorbing and eliminating
Nitrogen. The bar graph has nine rectangular segments. When the last seg-
ment appears, you have gone beyond
the no-decompression limit and now
require mandatory decompression
stops.
h. Oxygen Bar Graph: Graphically shows
your exposure to an elevated partial
pressure of Oxygen (PO
2
). The bar
graph has eight segments. When the
eighth segment appears, you have
reached 100% of the CNS clock.
Figure 14.
Dive Mode - Primary Display