Chapter 6 Analyzing Data in an RQ Study
Configuring Analysis Settings
64 Applied Biosystems 7300/7500/7500 Fast Real-Time PCR System Relative Quantification Getting Started Guide
Notes
6. Select the Control Type if the study contains both
multiplex and nonmultiplex reactions.
Note: The Multiplexed or Non-Multiplexed
options are active only if the plates loaded for
analysis contain both multiplexed and
nonmultiplexed reactions that share the same
endogenous control.
7. Select the RQ Min/Max Confidence level.
Note: The SDS Software 1.3.1 uses this value to
calculate error bars for gene expression levels, as
explained in “Error Bars for Gene Expression
Plots” on page 73.
8. Optionally, select Remove Outliers to enable the
SDS Software 1.3.1 to automatically identify and
filter outliers for groups containing at least four
replicates.
Note: You can also remove outliers manually, as
explained in “Omitting Samples from a Study”
on page 75.
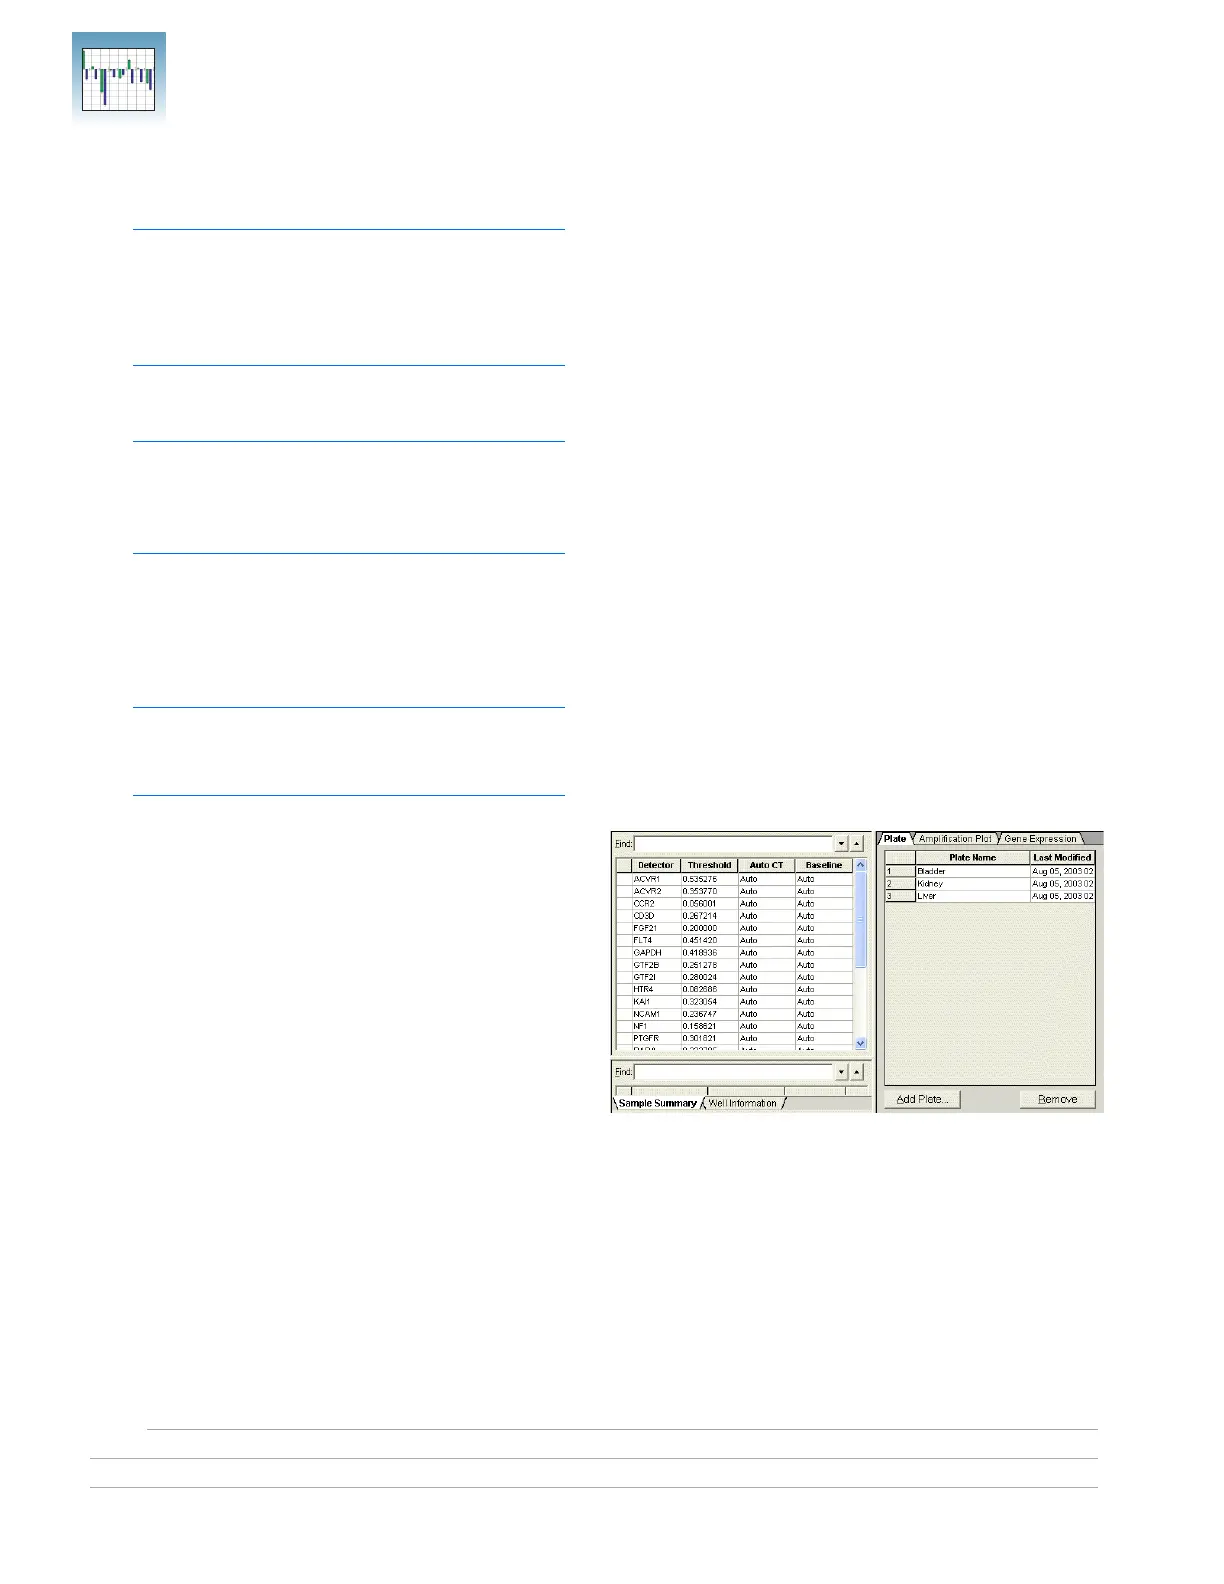
9. Click OK & Reanalyze. The detector
information appears in the RQ Detector grid.
After analysis, the Threshold column displays
the automatically calculated threshold values.
The Auto Ct and Baseline columns are set to
“Auto.”
For more information about the settings in the
Analysis Settings dialog box, refer to the Online
Help.
After the analysis, verify that the baseline and
threshold were called correctly for each detector, as
explained in the following section.