Chapter 6 Analyzing Data in an RQ Study
Analyzing and Viewing the Results of the RQ Study
Applied Biosystems 7300/7500/7500 Fast Real-Time PCR System Relative Quantification Getting Started Guide 73
Notes
6
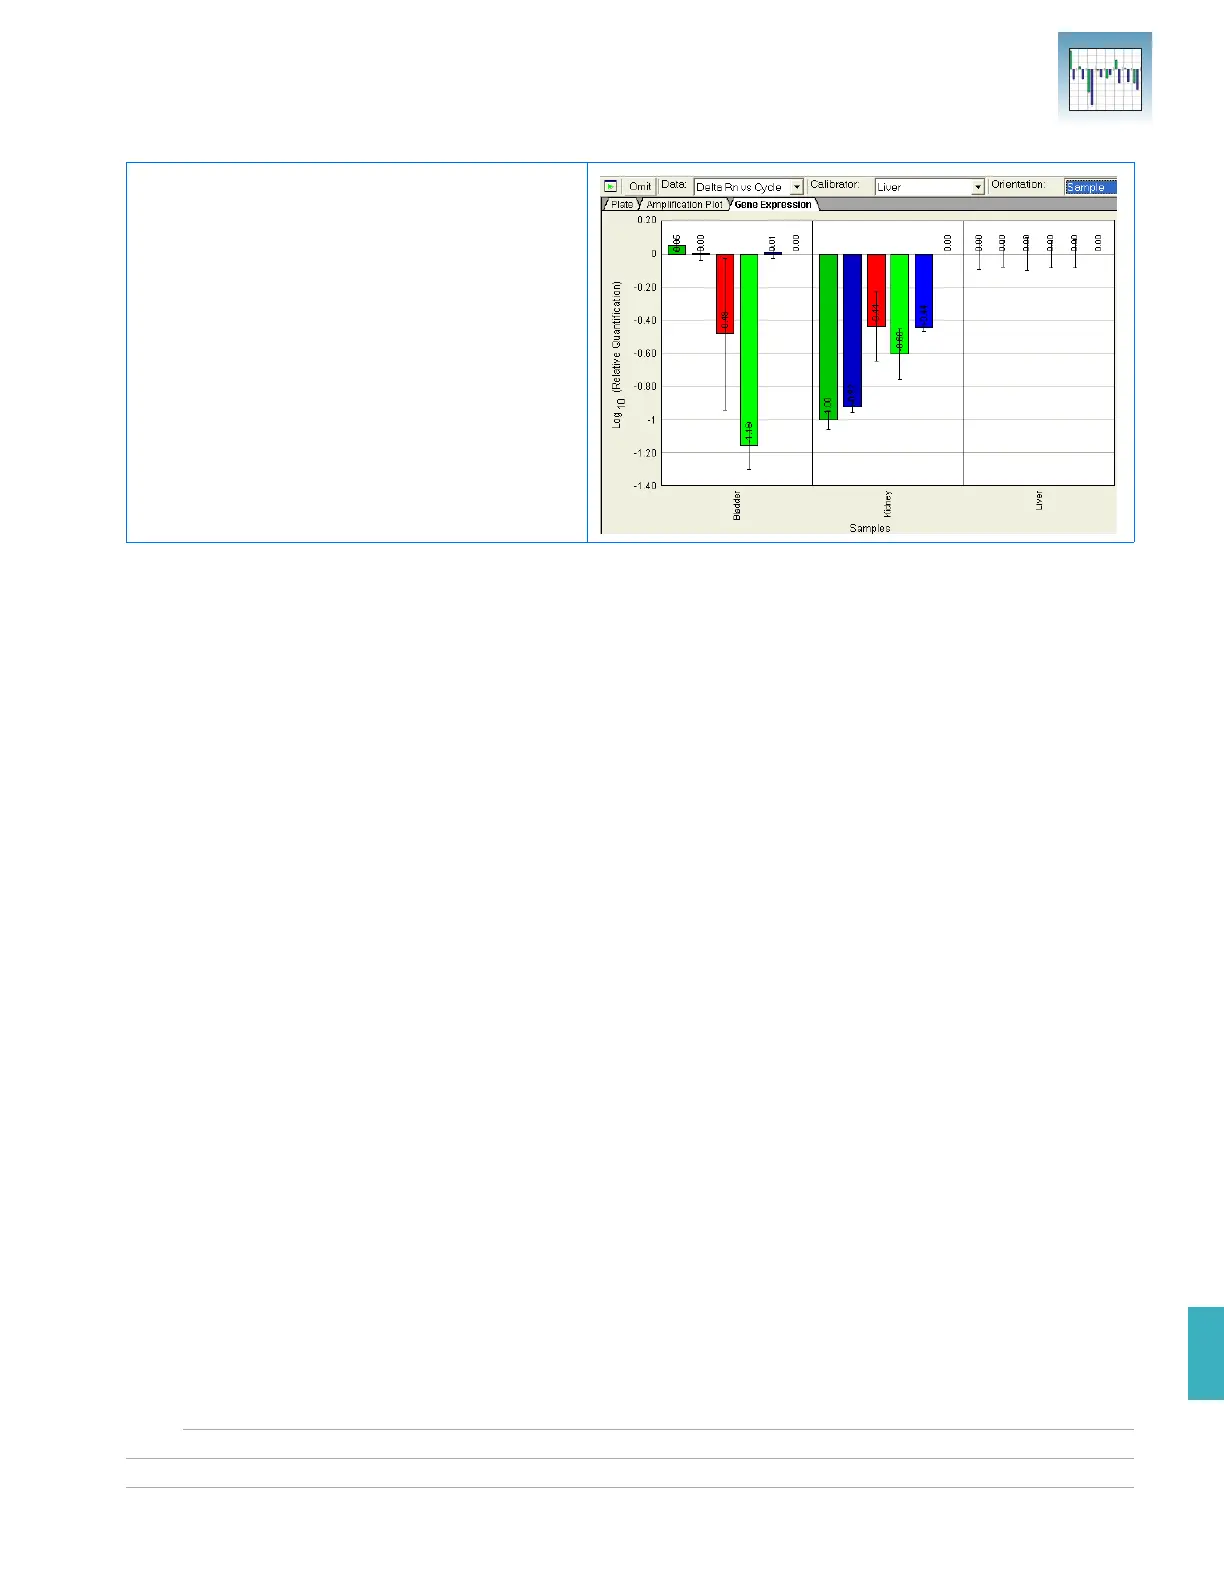
Error Bars for
Gene Expression
Plots
The SDS Software 1.3.1 displays error bars for each column in the plot, provided that the
associated expression level was calculated from a group of two or more replicates. The
error bars display the calculated maximum (RQMax) and minimum (RQMin) expression
levels that represent standard error of the mean expression level (RQ value).
Collectively, the upper and lower limits define the region of expression within which the
true expression level value is likely to occur.
The SDS Software 1.3.1 calculates the error bars based on the RQMin/Max Confidence
Level in the Analysis Settings dialog box (see page 63).
Gene Expression Plot Orientation: Sample
Samples are plotted on the x-axis, and each bar
shows the set of sample values of a single
detector.