Chapter 6 Analyzing Data in an RQ Study
Omitting Samples from a Study
Applied Biosystems 7300/7500/7500 Fast Real-Time PCR System Relative Quantification Getting Started Guide 75
Notes
6
Omitting Samples from a Study
Experimental error may cause some wells to amplify
insufficiently or not at all. These wells typically
produce C
T
values that differ significantly from the
average for the associated replicate wells. If included
in the calculations, these outlying wells (outliers) can
result in erroneous measurements.
To ensure precise relative quantification, you must
carefully view replicate groups for outliers. You can
remove outliers manually using the C
T
vs. Well
Position Amplification Plot.
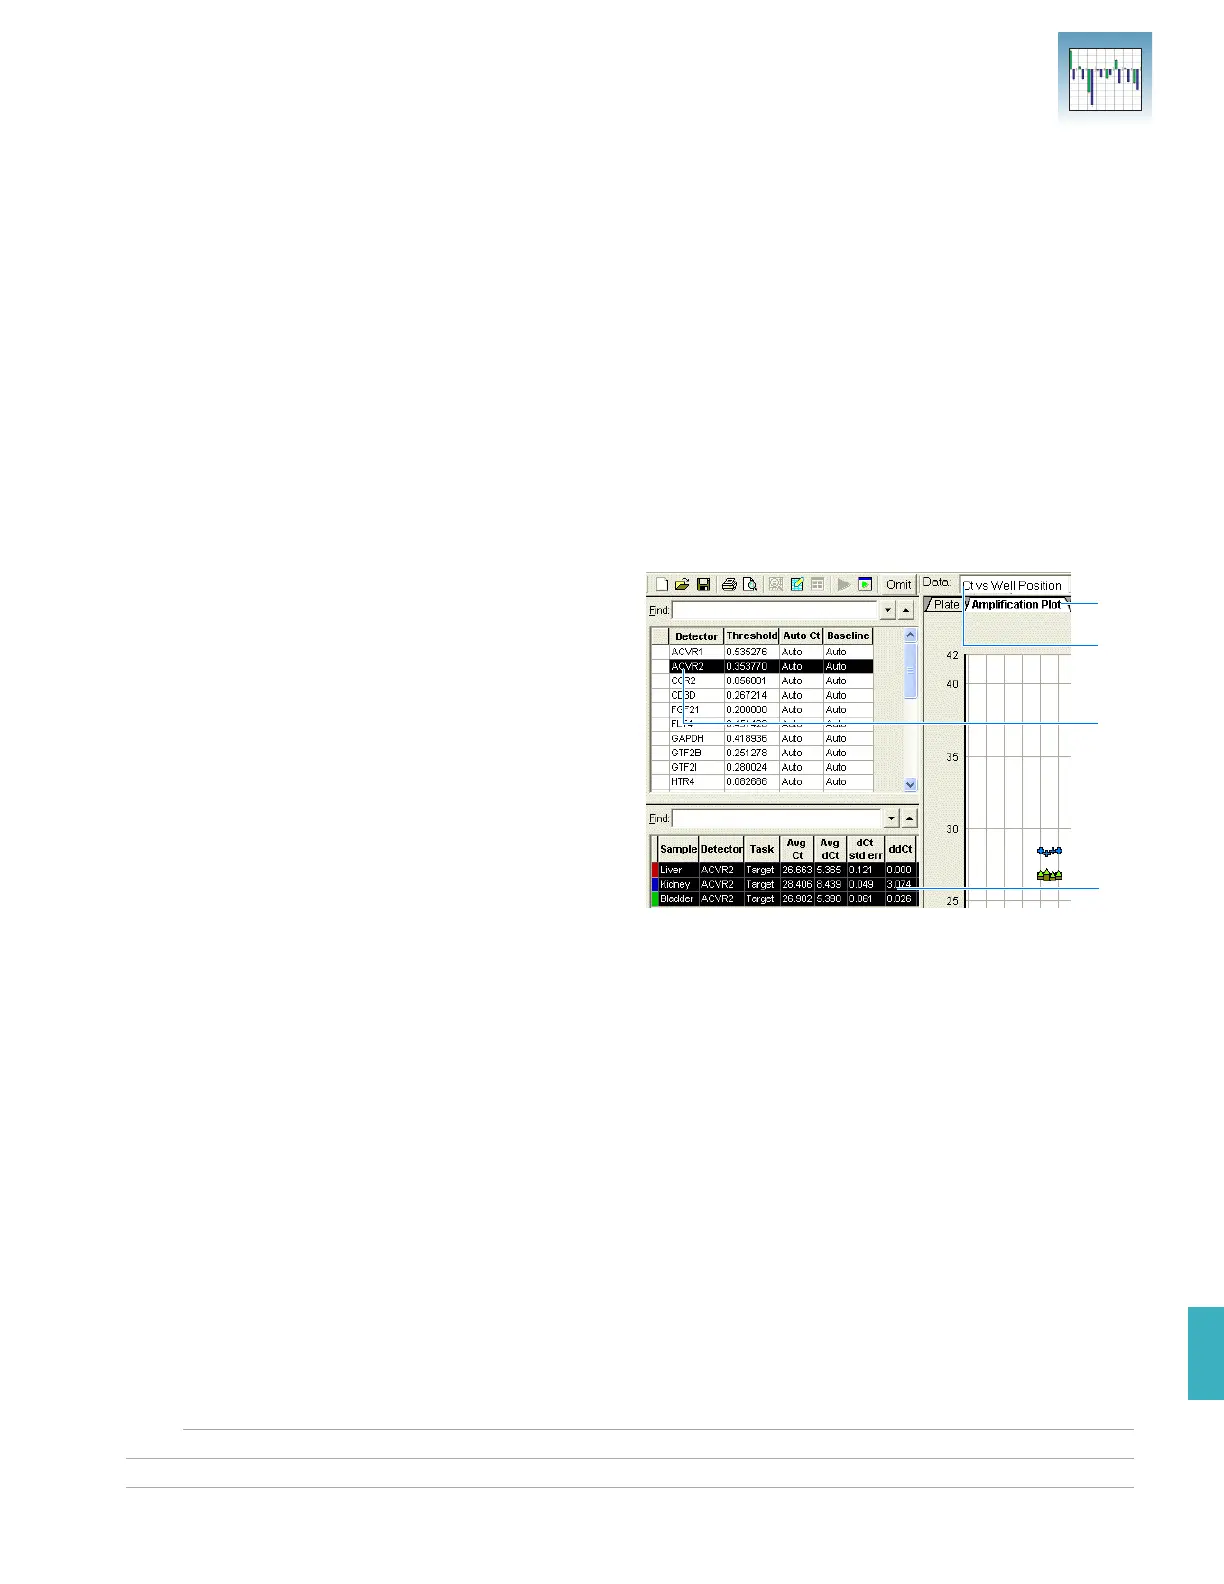
To remove samples from an RQ Study:
1. Select the Amplification Plot tab.
2. In the Data drop-down list, select Ct vs. Well
Position.
3. In the RQ Detector grid, select a detector to
examine. All samples that use this detector are
displayed in the RQ Samples grid.
4. In the RQ Samples grid, click to select the
samples to display in the Amplification Plot.
1
2
3
4