Chapter 6 Analyzing Data in an RQ Study
Analyzing and Viewing the Results of the RQ Study
70 Applied Biosystems 7300/7500/7500 Fast Real-Time PCR System Relative Quantification Getting Started Guide
Notes
Analyzing and Viewing the Results of the RQ Study
Selecting
Detectors to
Include in Results
Graphs
In the RQ Detector Grid, select detectors to include in the result graphs by clicking a
detector. (Ctrl-click to include multiple detectors; Click-drag to include multiple
adjacent detectors.)
The corresponding samples appear in the RQ Sample Grid. Depending on which tab you
select in the RQ Results Panel (Plate, Amplification Plot, or Gene Expression), analysis
results are displayed.
To see information about a specific well, select the Well Information tab.
Sample Experiment
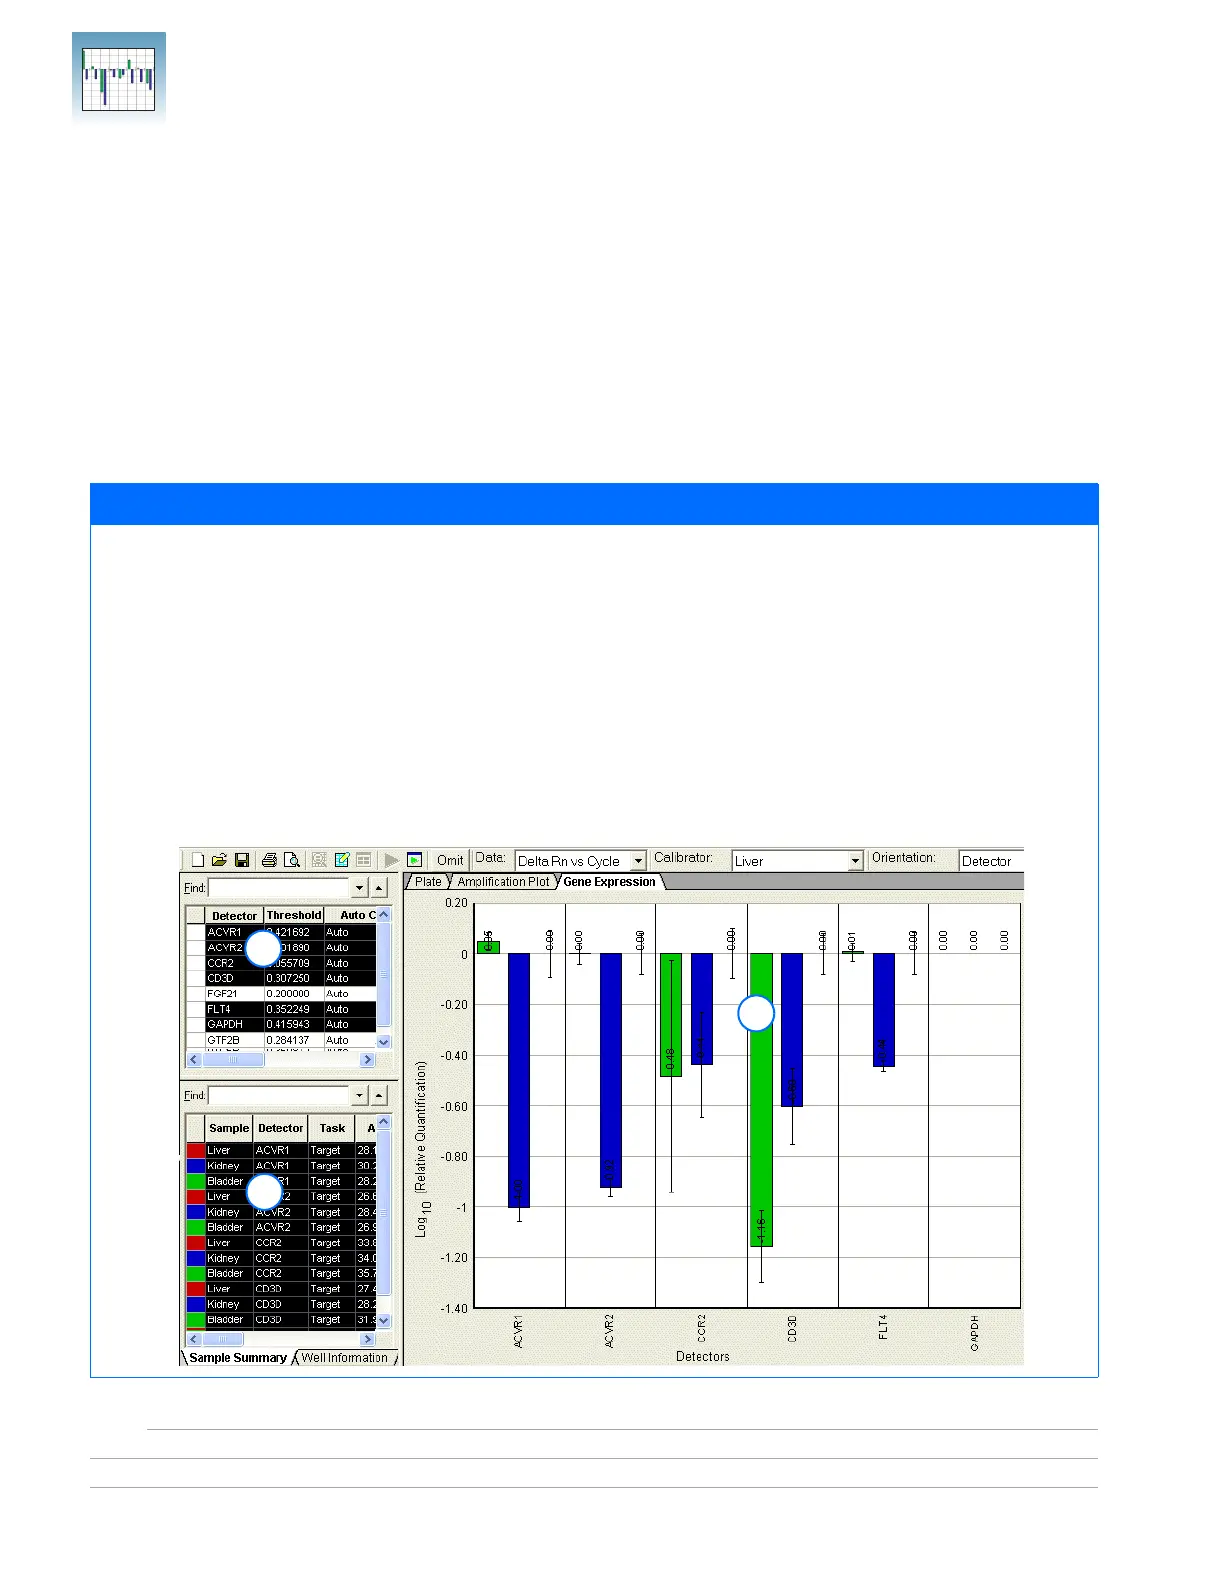
Suppose that you want to view the comparative gene expression levels of the following genes when the liver tissue is used
as the calibrator: ACVR1, ACVR2, CCR2, CD3D, and FLT4. Selecting the detectors in the RQ Detector grid (1) displays the
sample information in the RQ Sample grid (2) and in a result graph in the RQ Results panel (3). Note that:
• The Gene Expression tab is selected, and the gene expression levels are sorted by detector.
• Gene expression levels for bladder samples are indicated by the green bar; those for kidney samples by the blue bar.
These colors also indicate the samples in the RQ Sample Grid and the RQ Results Panel plots.
• Because liver samples are used as calibrators, the expression levels are set to 1. But because the gene expression levels
were plotted as log
10
values (and the log
10
of 1 is 0), the expression level of the calibrator samples appear as 0 in the
graph.
• Because the relative quantities of the targets are normalized against the relative quantities of the endogenous control,
the expression level of the endogenous control is 0; there are no bars for GAPDH.
• Fold-expression changes are calculated using the equation 2
−∆∆CT
.
1
2
3