Chapter 6 Analyzing Data in an RQ Study
Adjusting the Baseline and Threshold
Applied Biosystems 7300/7500/7500 Fast Real-Time PCR System Relative Quantification Getting Started Guide 69
Notes
6
3. Set the baseline for the detector.
a. Under Analysis Settings, select Manual Baseline.
b. Enter values in the Start Cycle and End Cycle fields, ensuring that the
amplification curve growth begins at a cycle after the End Cycle value.
Note: After you change a baseline or threshold setting for a detector, the Analyze
button ( ) is enabled, indicating that you must reanalyze the data.
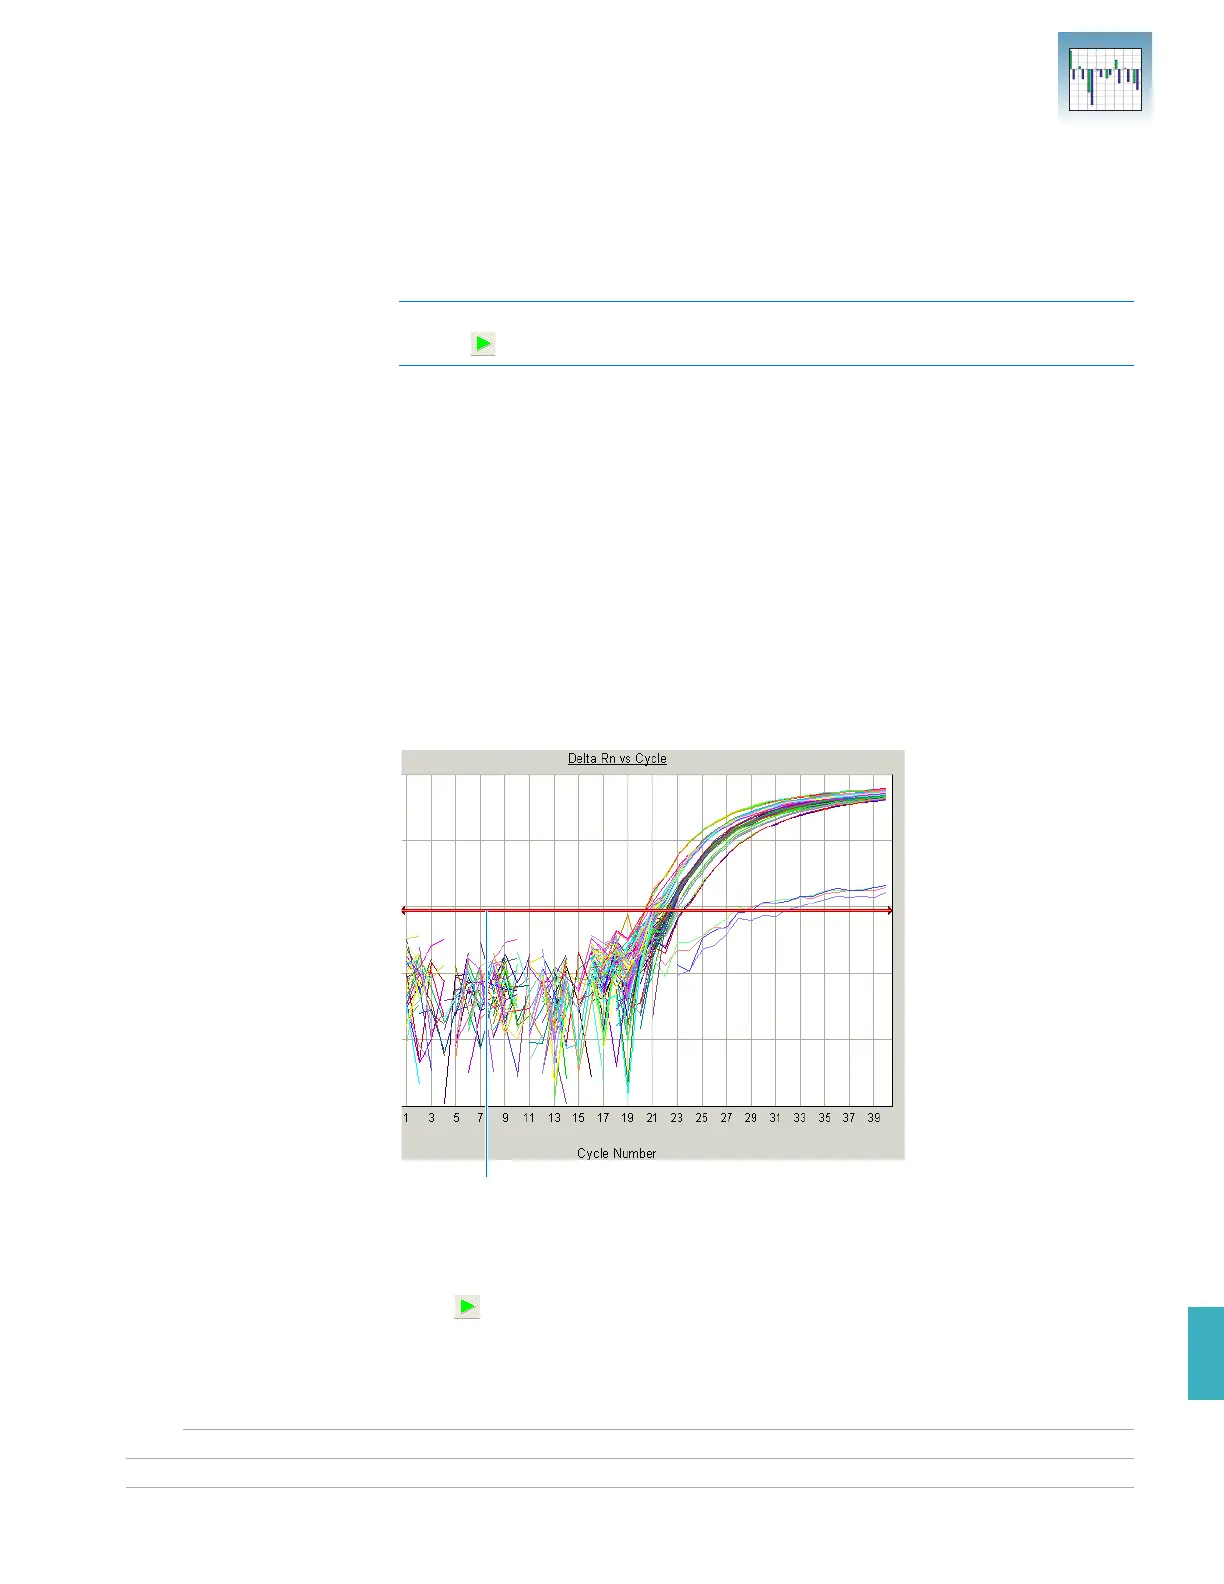
4. Set the threshold for the detector.
a. Under Analysis Settings, select Manual Ct.
b. Drag the threshold setting bar so the threshold is:
• Above the background
• Below the plateaued and linear regions of the amplification curve
• Within the exponential phase of the amplification curve
The SDS Software 1.3.1 adjusts the threshold value and displays it in the
Threshold field after reanalyzing.
5. Repeat steps 2 through 4 to set the baseline and threshold values for all remaining
detectors in the study.
6. Click or select Analysis > Analyze to reanalyze the data using the adjusted
baseline and threshold values.
Click and drag the Threshold setting
to adjust the threshold. The bar turns
red, indicating that the threshold has
been changed.