Chapter 6 Analyzing Data in an RQ Study
Analyzing and Viewing the Results of the RQ Study
Applied Biosystems 7300/7500/7500 Fast Real-Time PCR System Relative Quantification Getting Started Guide 71
Notes
6
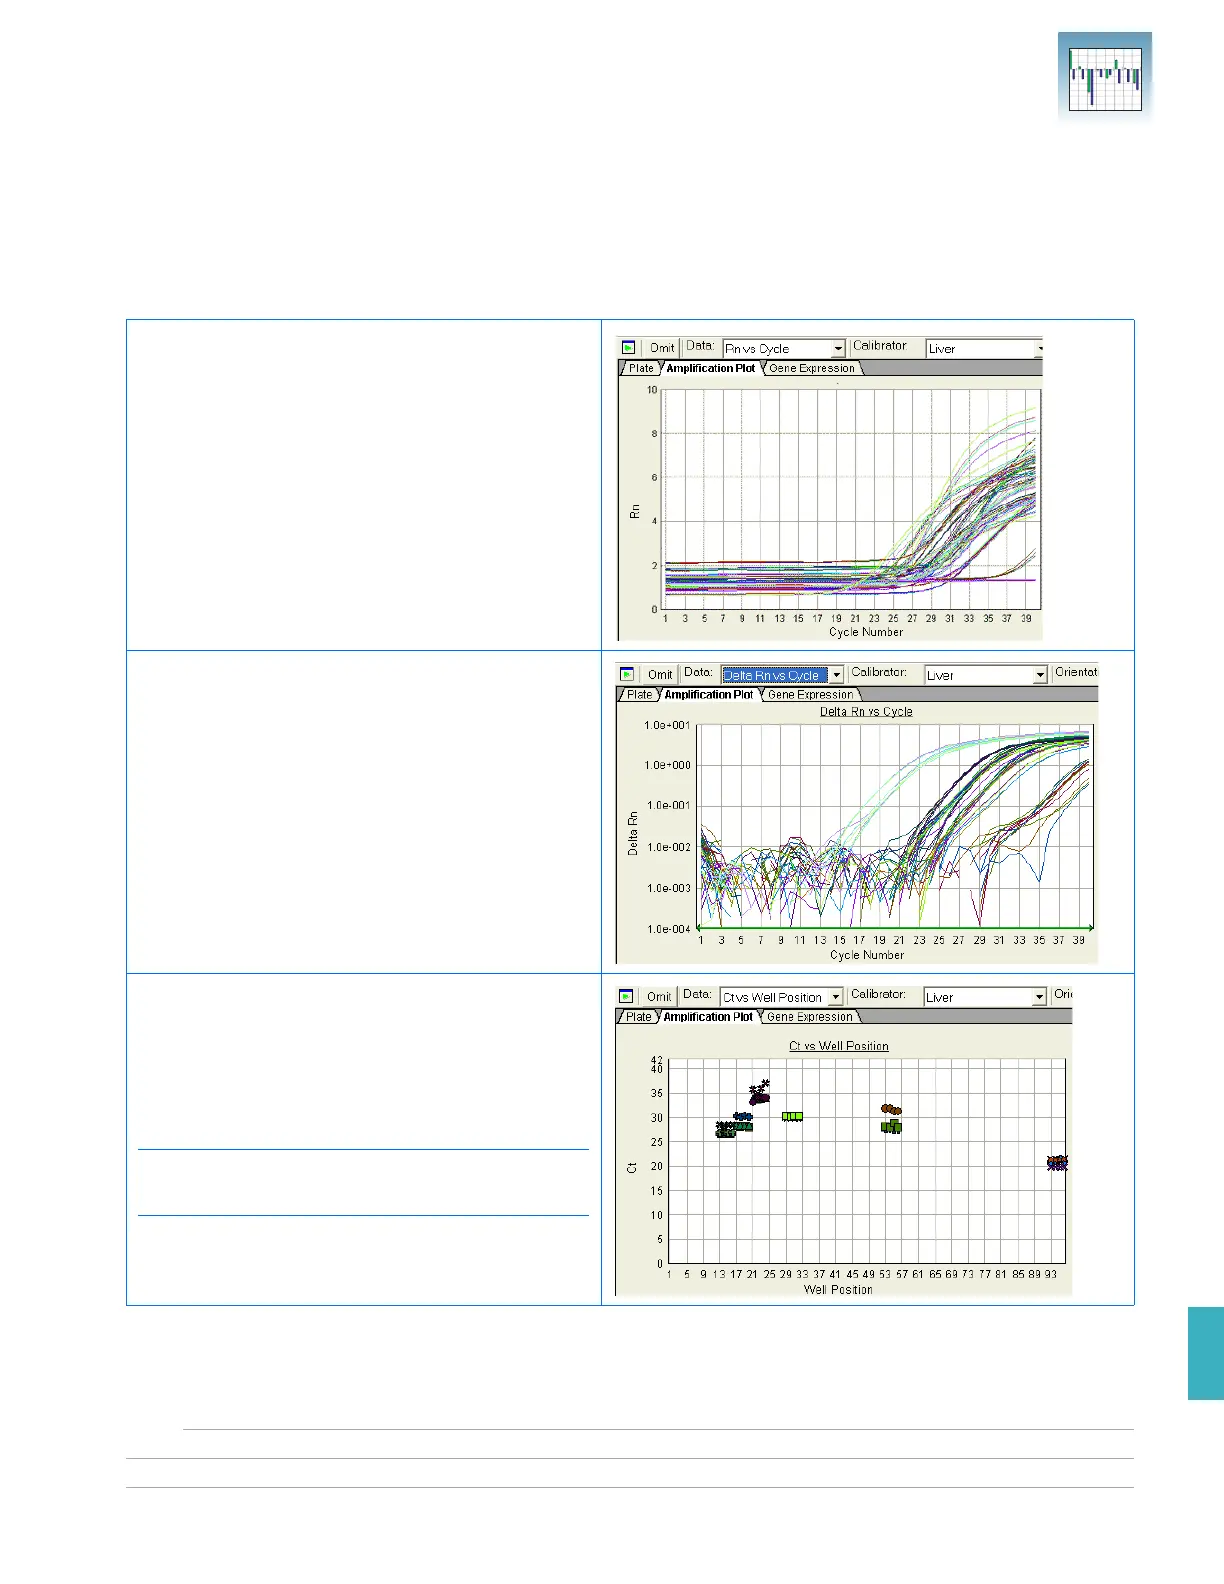
Amplification Plot The three Amplification Plots allow you to view post-run amplification of specific
samples. The Amplification Plots display all samples for selected detectors.
You can adjust graph settings by double-clicking the y- or x-axes of a plot to display the
Graph Settings dialog, as shown on page 33.
Rn vs. Cycle (Linear) View
Displays normalized reporter dye fluorescence (R
n
)
as a function of cycle. You can use this plot to
identify and examine irregular amplification.
For more information about R
n
, refer to the Real-
Time PCR Systems Chemistry Guide.
∆Rn vs. Cycle (Log) View
Displays dye fluorescence (∆R
n
) as a function of
cycle number. You can use this plot to identify and
examine irregular amplification and to manually
set the threshold and baseline parameters for the
run.
Ct vs. Well Position View
Displays threshold cycle (C
T
) as a function of well
position. You can use this plot to locate outliers
from detector data sets (see “Omitting Samples
from a Study” on page 75 for more information).
Note: If there is a data point at Ct0, this point is
undetermined, the data point is not actually Ct = 0.
 Loading...


