Chapter 6 Analyzing Data in an RQ Study
Analyzing and Viewing the Results of the RQ Study
72 Applied Biosystems 7300/7500/7500 Fast Real-Time PCR System Relative Quantification Getting Started Guide
Notes
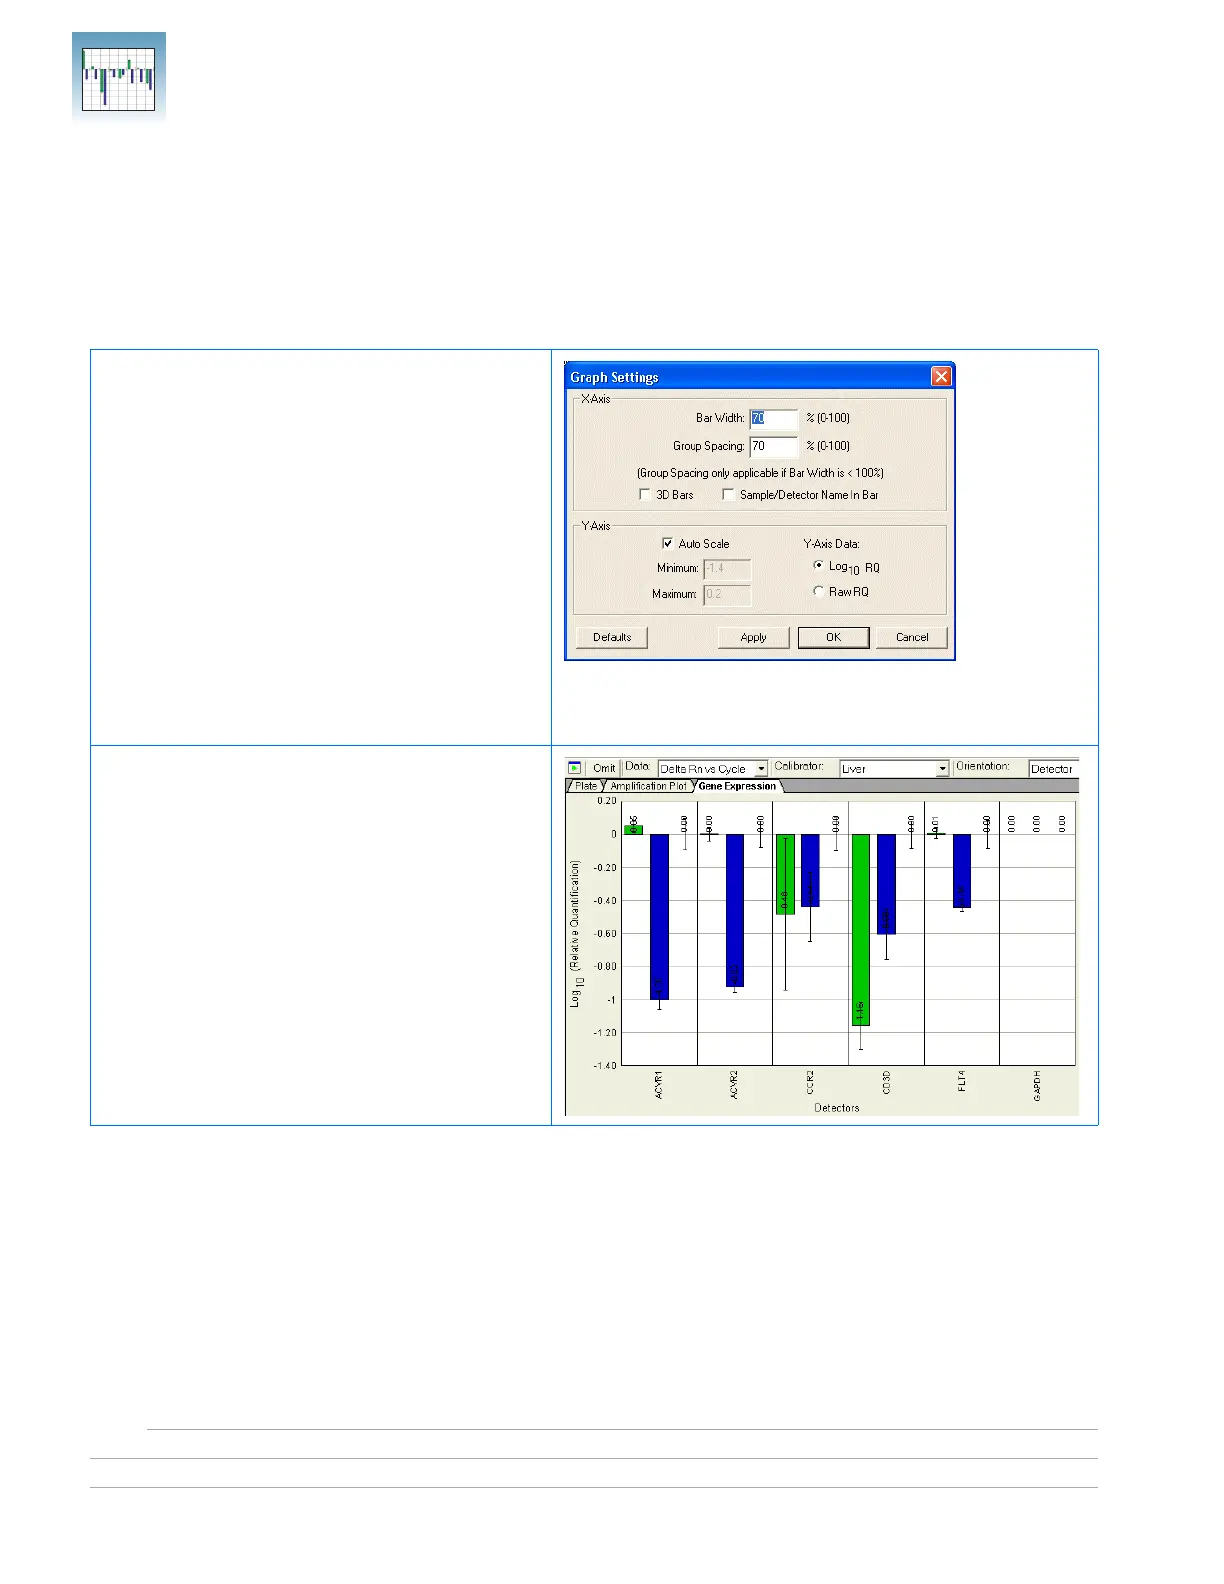
Gene Expression
Plot
Gene Expression plots show the expression level or fold-difference of the target sample
relative to the calibrator.
Because the calibrator is compared to itself, the expression level for the calibrator is
always 1. Because liver samples are used as calibrators, the expression levels are set to 1.
But because the gene expression levels were plotted as log
10
values (and the log
10
of 1 is
0), the expression level of the calibrator samples appear as 0 in the graph.
Adjusting Graph Settings
You can adjust graph settings for gene expression
plots in the Graph Settings dialog box, including:
•Bar width
•3D bars
• Autoscaling
• Data display as Log
10
RQ or Raw RQ
To access the Graph Settings, double-click on one
of the axes.
Refer to the Online Help for more information
about adjusting graph settings for gene
expression plots.
Gene Expression Plot Orientation: Detector
Detectors are plotted on the x-axis, and each bar
shows the detector value of a single sample.