Appendix B Example RQ Experiment
88 Applied Biosystems 7300/7500/7500 Fast Real-Time PCR System Relative Quantification Getting Started Guide
Notes
10. Analyze the RQ data, as explained in Chapter 6
on page 59.
a. Configure analysis settings ( ), using the
Auto Ct option and analyze the data.
Note: See “Configuring Analysis Settings”
on page 63 for details.
If you know the optimal baseline and
threshold settings for your experiment, you
can use the Manual Ct and Manual Baseline
options.
b. If necessary, manually adjust the baseline
and threshold.
Note: See “Adjusting the Baseline and
Threshold” on page 65.
c. Click , or select Analysis > Analyze to
reanalyze the data.
d. View analysis results by clicking a tab in the
RQ Results pane.
e. If desired, save the RQ Study document.
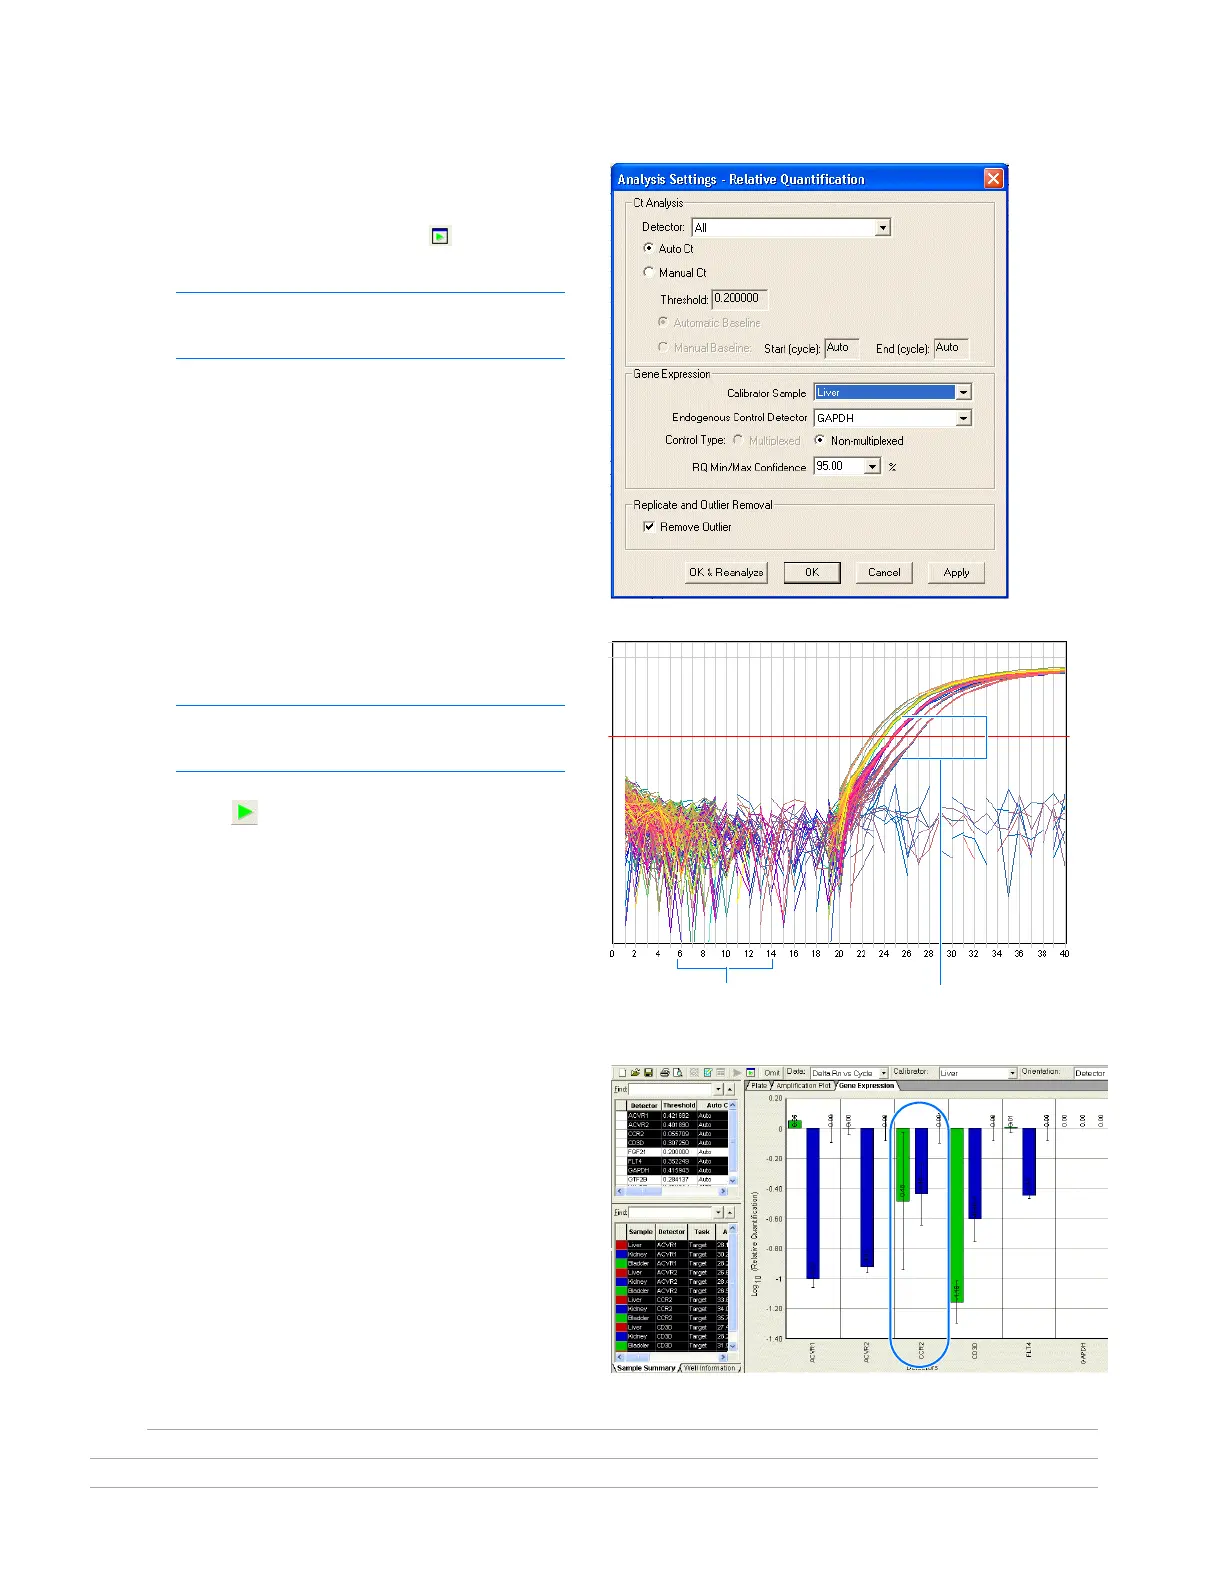
Conclusion
As shown in the figure on the right where liver is used
as the calibrator, expression levels of CCR2 are
greater in the liver than in the kidney or bladder
tissues of this individual.
Baseline is set before
amplification begins
Threshold falls within
exponential phase of curve

 Loading...


