Page 41
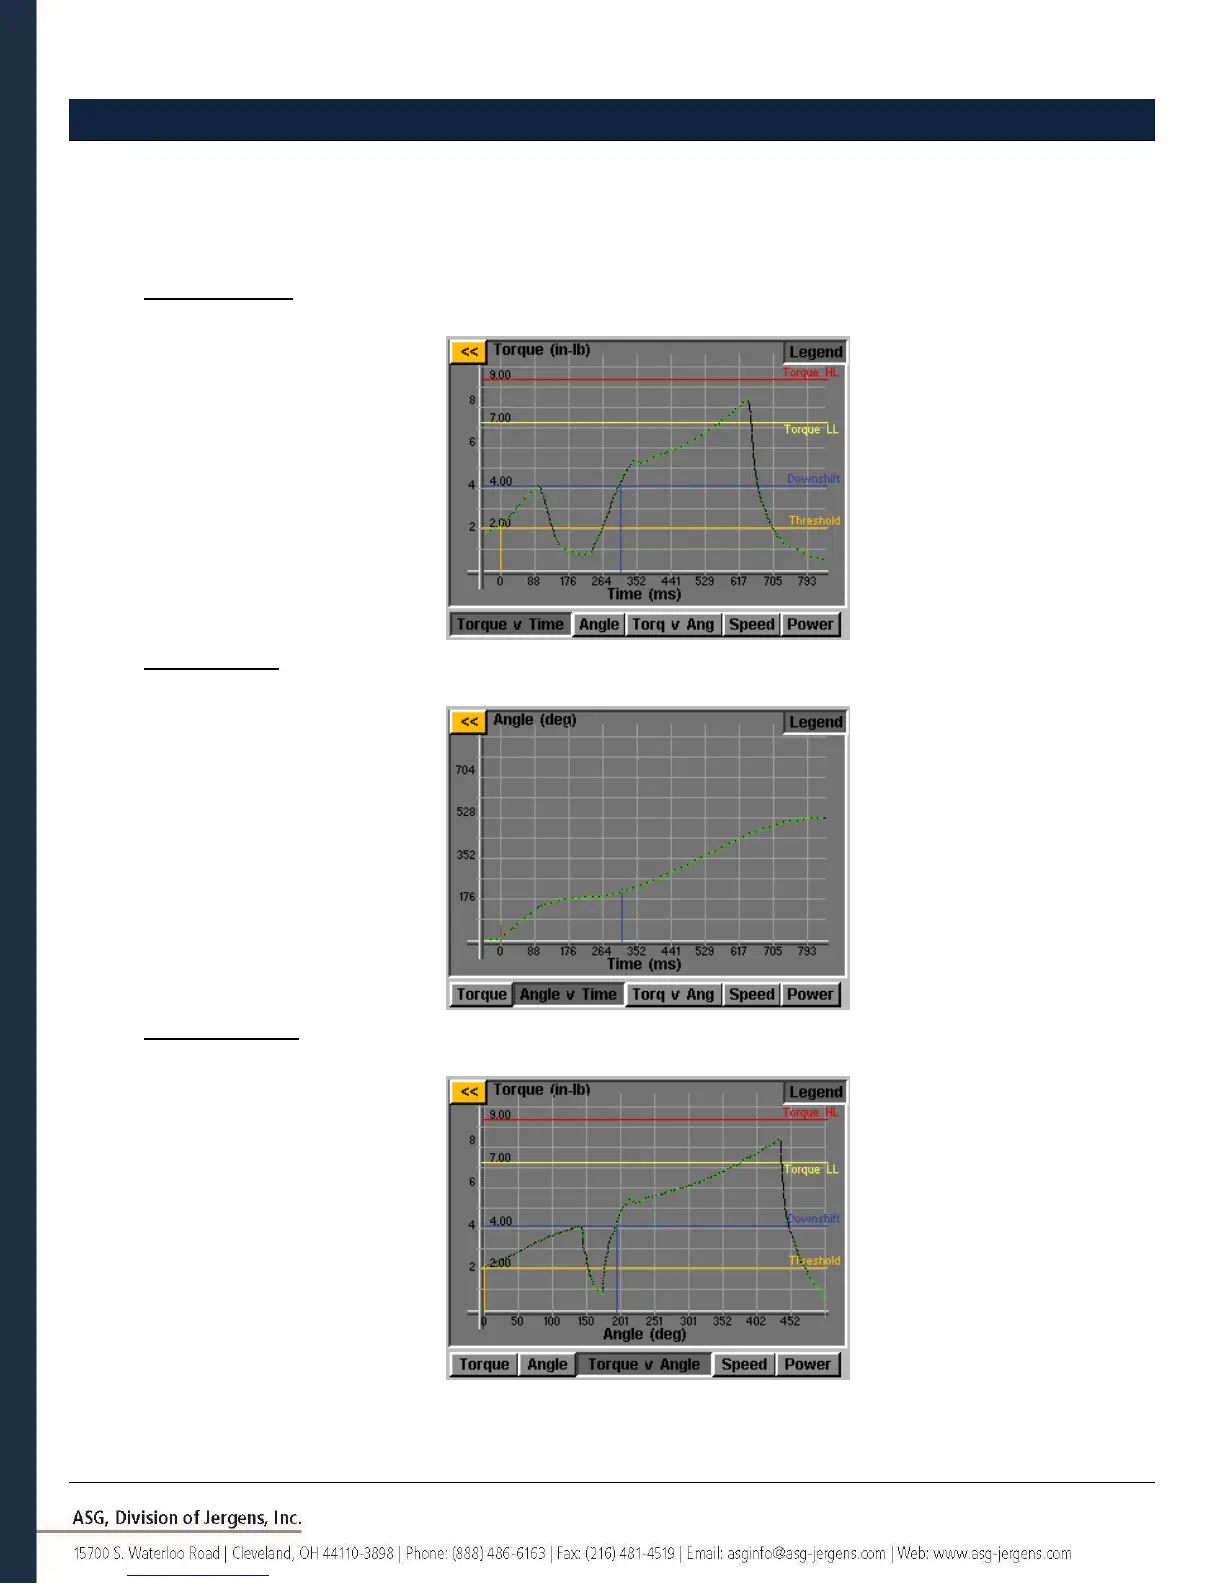
Graph Screens
In order to assist the user with setting up and trouble-shooting problem joints, the latest rundown is stored in the
controller in graph form. From the ‘Run Tool’ screen, tap the ‘Graph’ button at the bottom of the screen. Along the
bottom of the screen can be found the available graphs, tap the appropriate button to view:
• Torque vs. Time: Graphs the last rundown with Torque on the Y axis in whatever units are specified in the
parameter, and Time on the X axis in milliseconds (ms).
• Angle vs. Time: Graphs the last rundown with Angle on the Y axis in degrees (deg), and Time on the X axis in
milliseconds (ms).
• Torque vs. Angle: Graphs the last rundown with Torque on the Y axis in whatever units are specified in the
parameter, and Angle on the X axis in degrees (deg).