Version 5.2/5.4 69 January 2009
Troubleshooting Guide 13. Debugging Procedures
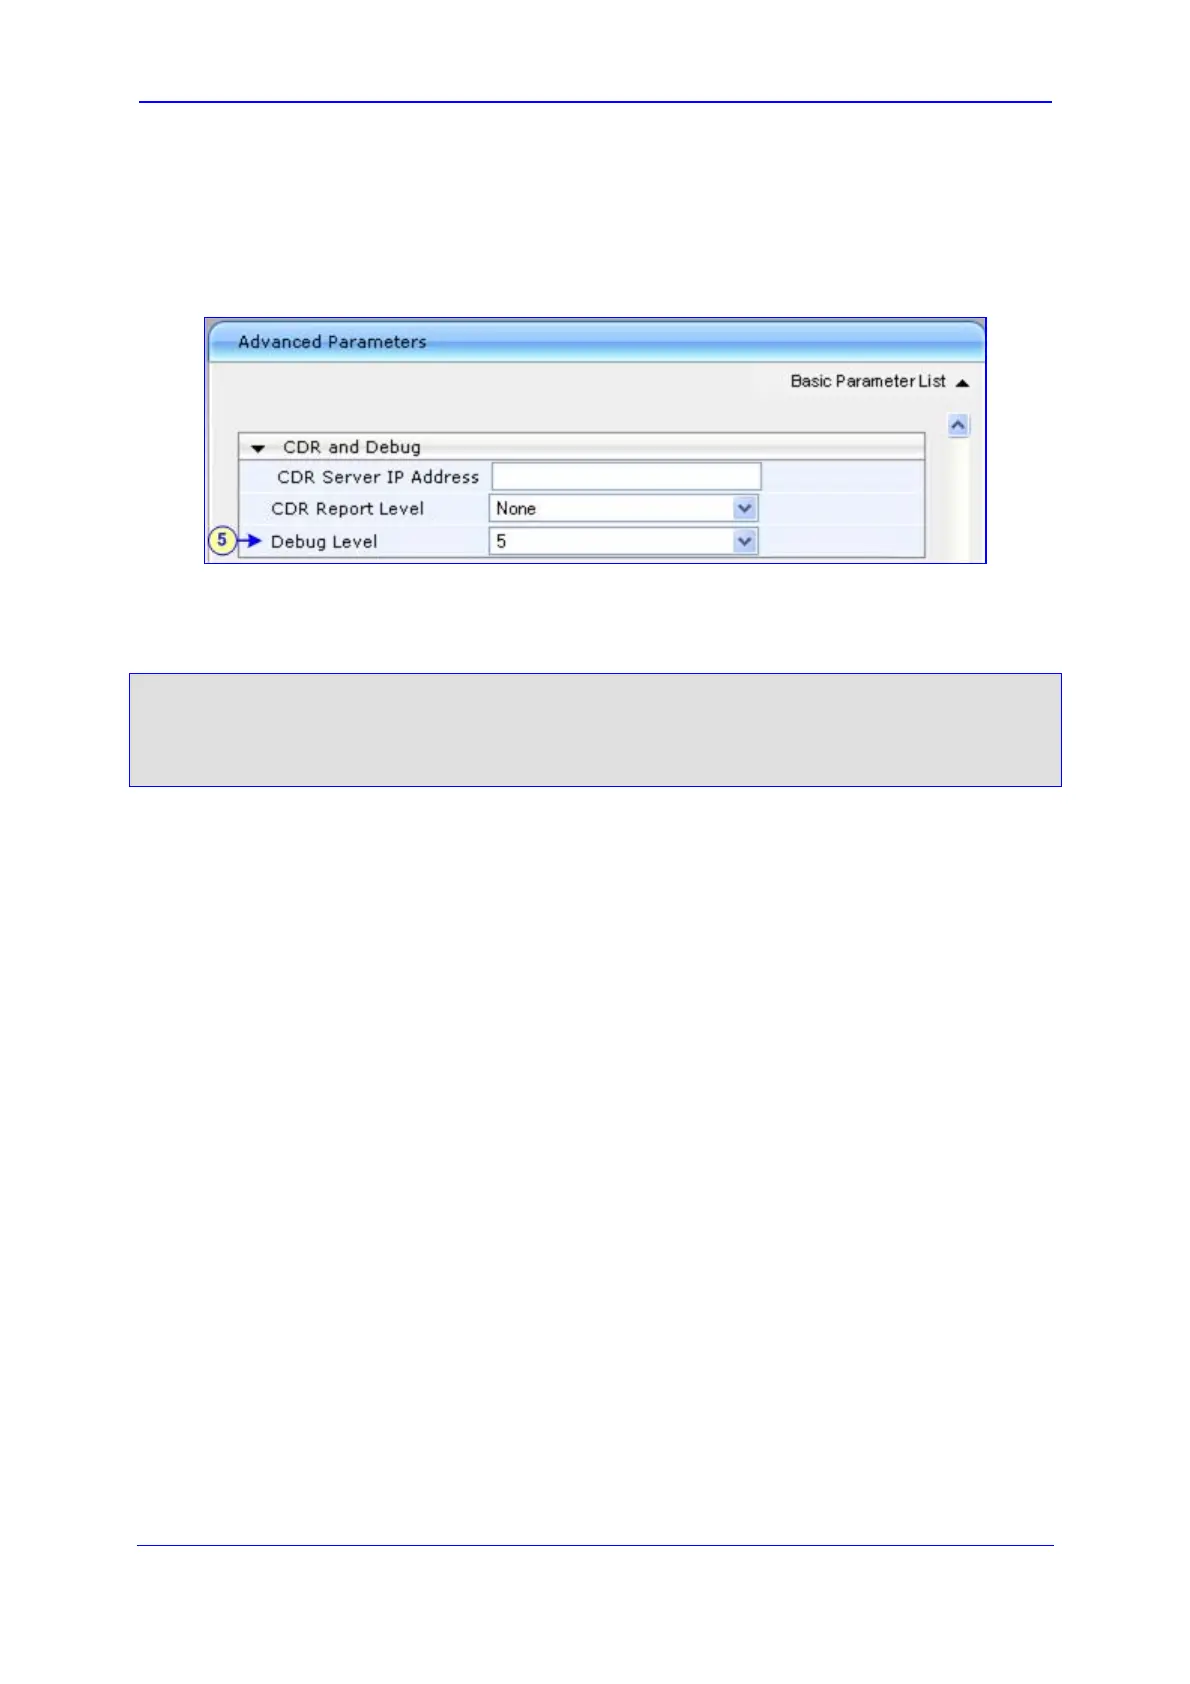
4. Open the Web interface 'Advanced Parameters' page (Web path SW Ver. 5.2: Protocol
Management menu > Advanced Parameters submenu > General Parameters; Web
path SW Ver. 5.4 and later: Configuration tab > Protocol Configuration menu > SIP
Advanced Parameters submenu > Advanced Parameters).
Figure 13-3: Determining Debug Level
5. From the 'Debug Level' drop-down list, select '5' if debug traces are required.
To enable syslog reporting, using the ini file, load an ini file to the device with the following
settings:
[Syslog]
SyslogServerIP = 192.168.2.35
EnableSyslog = 1
SyslogServerPort = 514
GWDebugLevel = 5
13.3 Wireshark Network Sniffer
Wireshark is a freeware packet sniffer application that allows you to view the traffic that is
being passed over the network. Wireshark can be used to analyze any network packets.
Wireshark can also be used to analyze RTP data streams and extract the audio from the
data packets (only for G.711). The audio can be saved as a *.pcm file.
¾ To record traffic that is sent to / from the device:
1. Install Wireshark on your PC. (You can download it from the following Web site:
http://www.wireshark.org/.)
2. Connect the PC and the device to the same hub.
3. If you are using a switch, use a switch with port mirroring for the port to which the
Wireshark is connected.
4. Start Wireshark.

 Loading...