40-2 9424200996
Power Quality BE1-11m
Figure 40-1. Metering Configuration, Power Quality Screen
Metering
BESTCOMSPlus Navigation Path: Metering Explorer, Power Quality
HMI Navigation Path: Metering Explorer, Power Quality
Power quality data can be viewed using BESTCOMSPlus, through the front-panel interface, and through
the web page interface. To view data using BESTCOMSPlus, use the Metering Explorer to open the
Power Quality tree branch.
Voltage
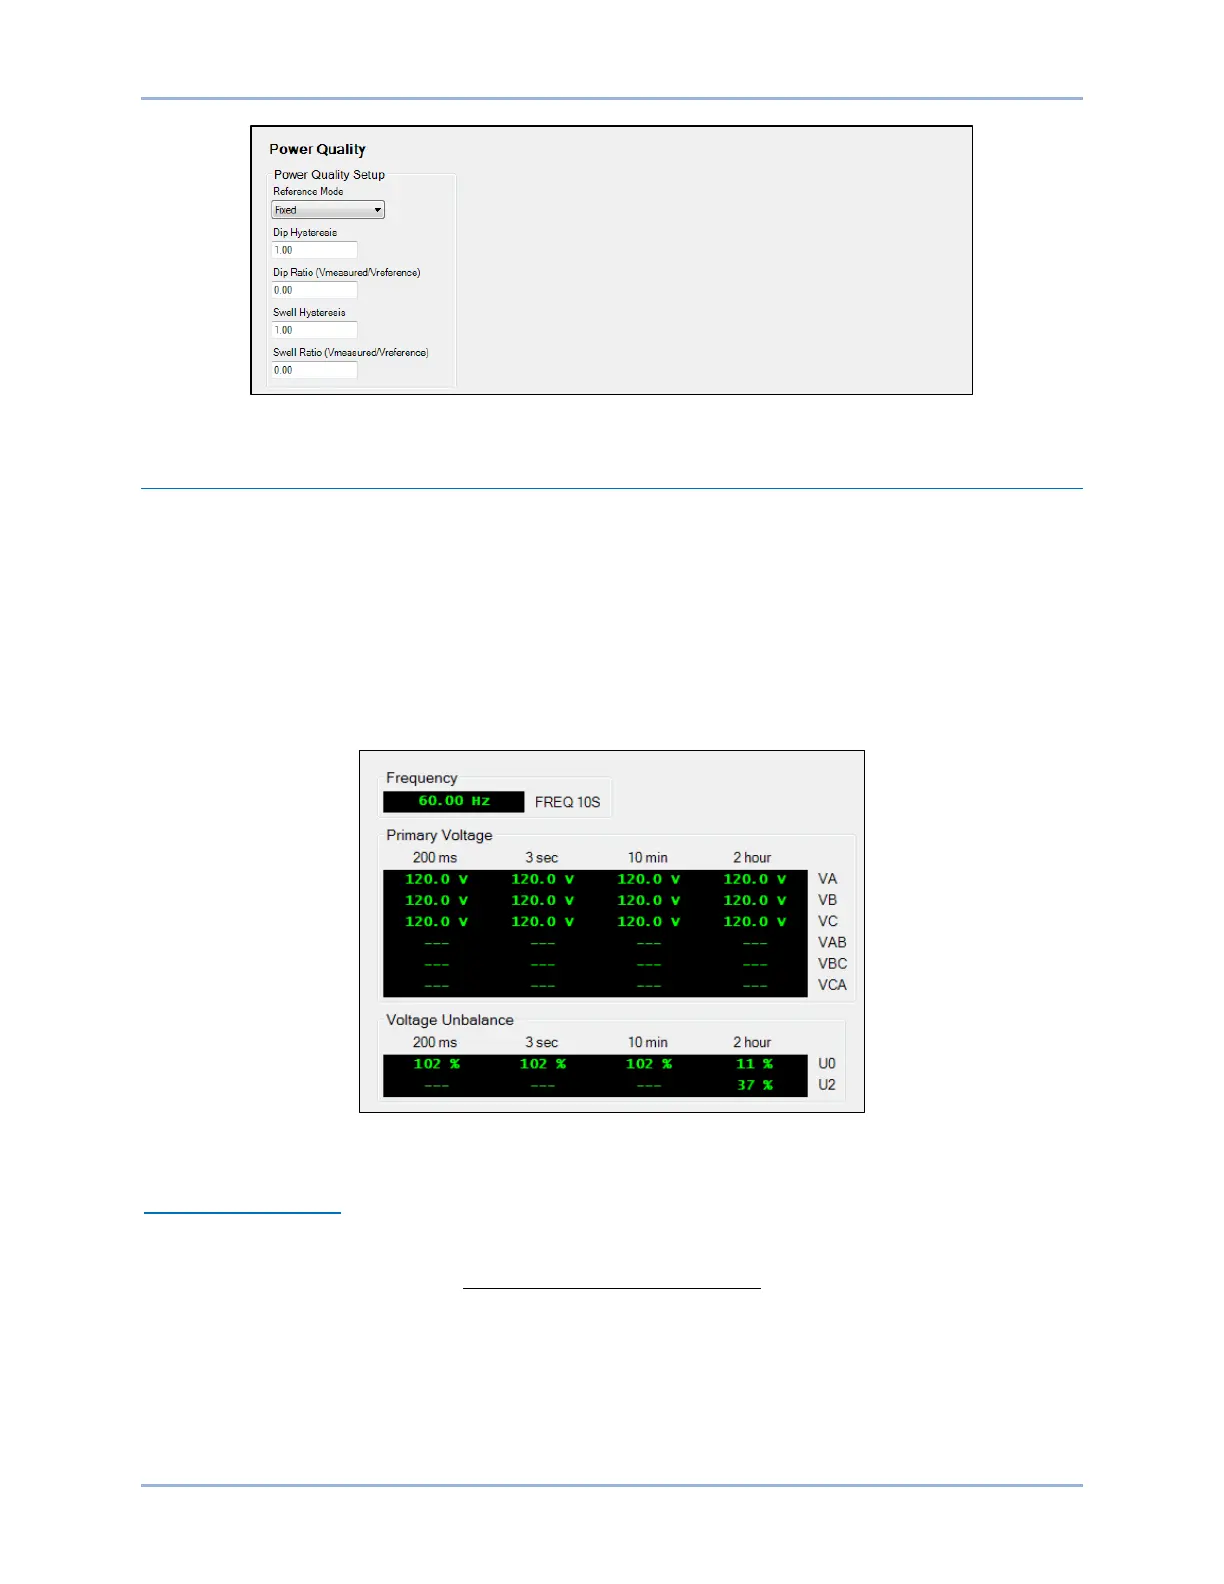
Figure 40-2 illustrates the Power Quality, Voltage screen.
Figure 40-2. Power Quality, Voltage Screen
10-Second Frequency
A 10-second average of the frequency is calculated using Equation 40-1.
Equation 40-1. 10-Second Frequency Calculation