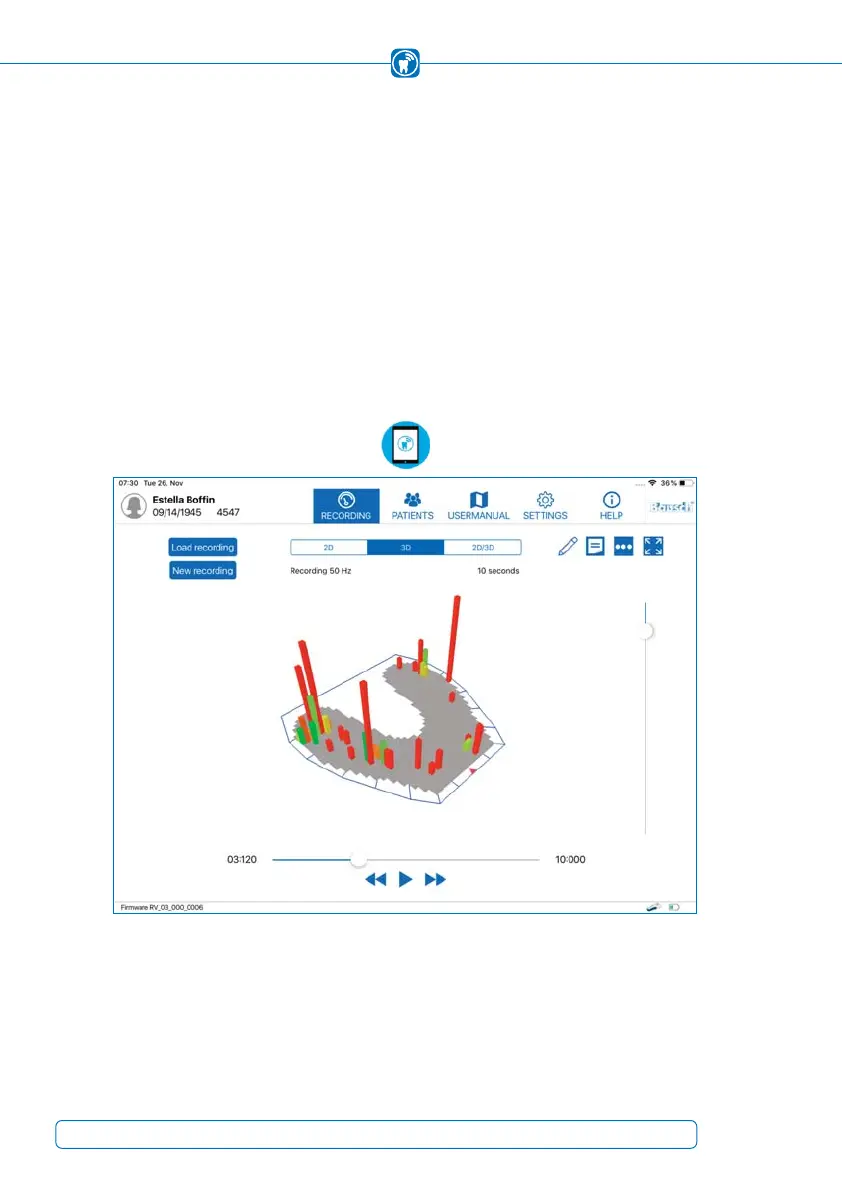
The relative pressure difference between these pressure points and surfaces is illustrated
by the height of the bars in the 3D view.
The bars show a color gradient from green to yellow to red and represent the relative
difference of a contact point to its adjacent contacts. A green color implies a small re-
lative difference between the adjacent contacts. The color gradient will turn from yellow
to red if the difference between the adjacent contacts will become higher.
In addition to the markings on the occlusal surfaces, like with conventional occlusion
test materials, OccluSense
®
is able to record the temporal sequence of intercuspidation.
During this dynamic process, the pressure points and surfaces change in their appea-
rance.
Figure 40: 3D view of the occlusal pressure distribution
54