31
P073GUI001 - e-Celsius Medical Connect System User Manual.4 - EN
Displays the graph with all the capsules
active of the watch (C1/C2/C3)
Display the graph of C1 only
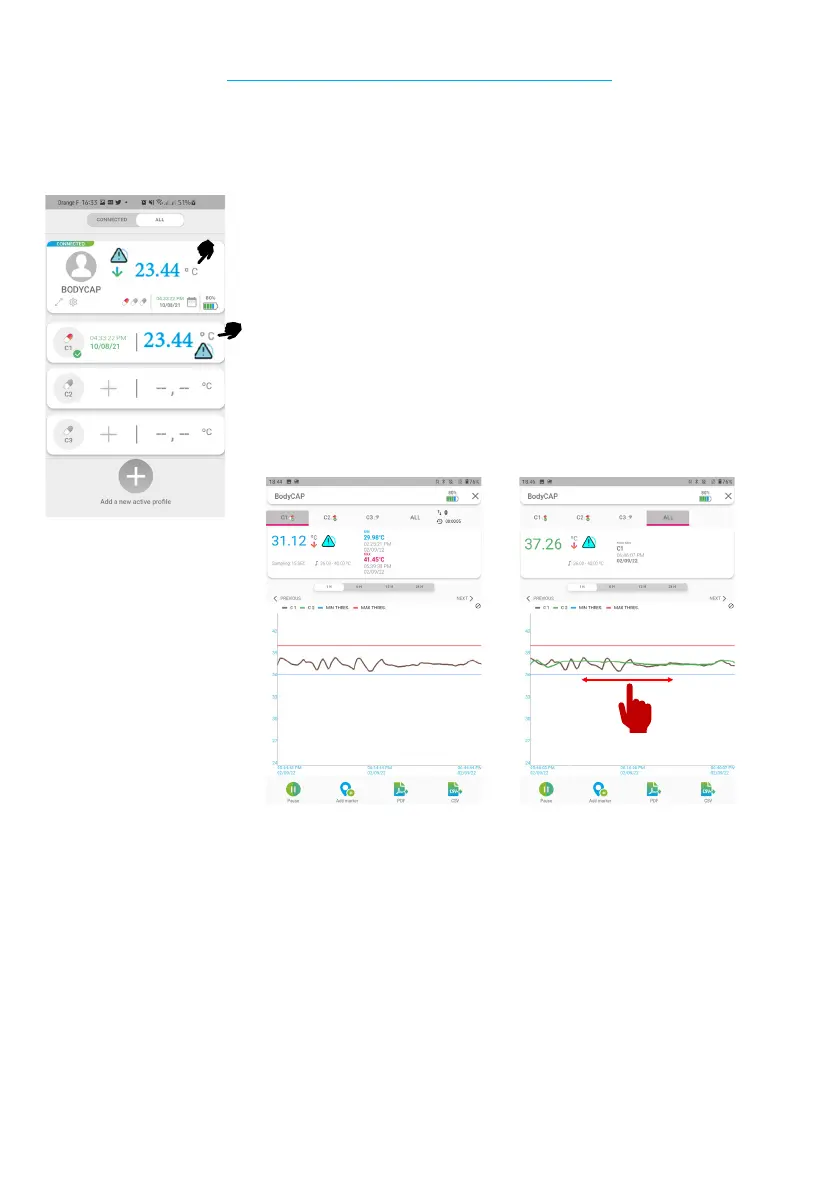
The temperature data of the capsules can also be visualized in graphic form.
To do this, simply click on a capsule temperature to display the corresponding graph or on the generic
temperature of the prole to display the graph of all the associated capsules.
Example of a C1 graph
It is possible to navigate in the graph by dragging your nger on the active range. (to the left or to the right)
On the upper part of the screen you will be able to see several information related to this capsule:
* The minimum temperature seen by the capsule (since the last reset)
* The maximum temperature seen by the capsule (since the last reset)
* The triggering of the alarm if the thresholds are reached or exceeded
CONSULT THE TEMPERATURE GRAPHS
Figure 14 - Viewing the temperature graphs
Exemple de graphique C1 + C2