© 1999-2017 Citrix Systems, Inc. All rights reserved. p.171https://docs.citrix.com
Througput Statistics or Data Usage Statistics.
The graphs provide you to check the data consumption and throughput statistics for various periods of time, like:
Last 1 hour
Last 1 day
Last 1 week
Last 1 month, and
Previous month
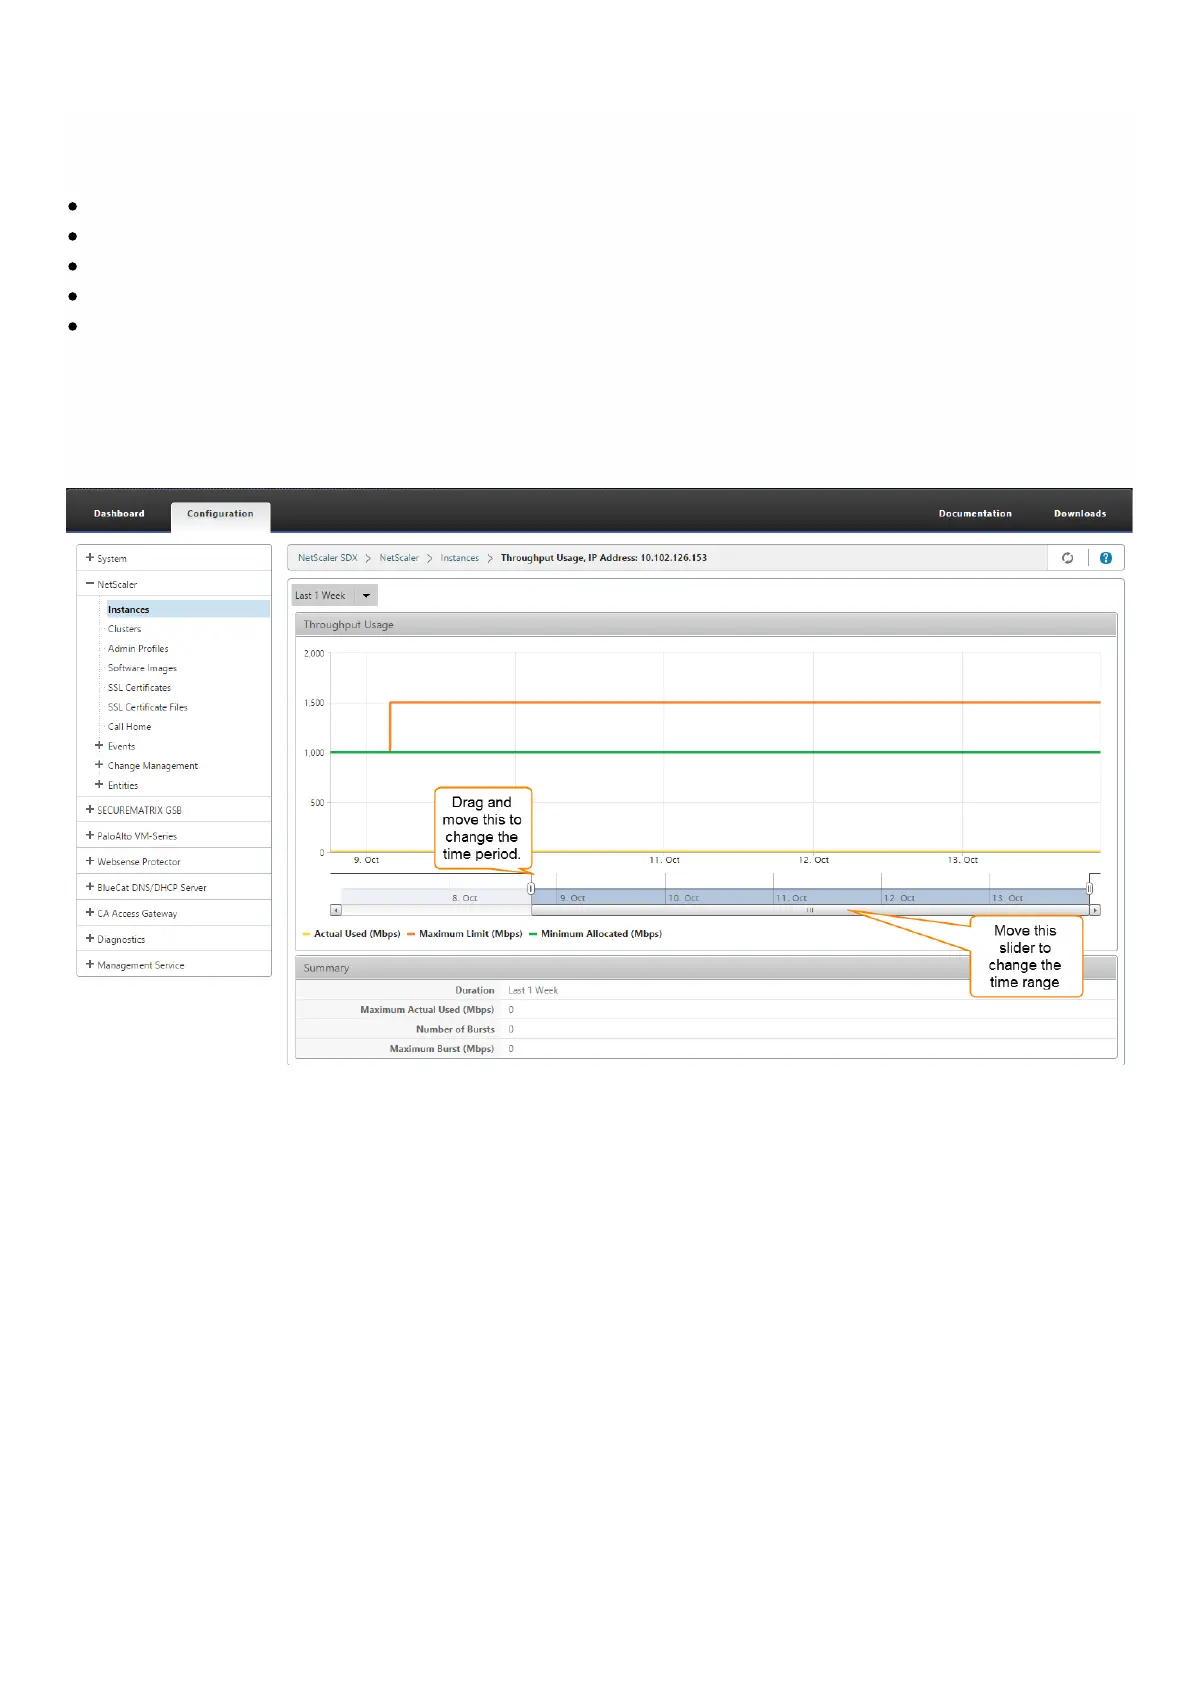
You can also select a specific time period in the graph by adjusting the slider at the bottom of the graph. The graph also
shows the data consumption or throughput data for a specific time by moving your mouse over the lines in the graph.
The following illustration shows a sample graph of throughput data for 1 week: