20
All UPS added to the PowerPanel® Cloud with the same account are
displayed in the Dashboard (Figure 3.1). Users can monitor the UPS
directly with the statistics at the bottom-left corner. With this
information, users can check device list on the right to find out which
UPS has problems. PowerPanel® Cloud provides Group mode and UPS
mode to display the UPS structure (❷, ❸ in Figure 3.2).
Click the Group to display the UPS list classified by group. The UPS in
the same group has the same time zone. Click the
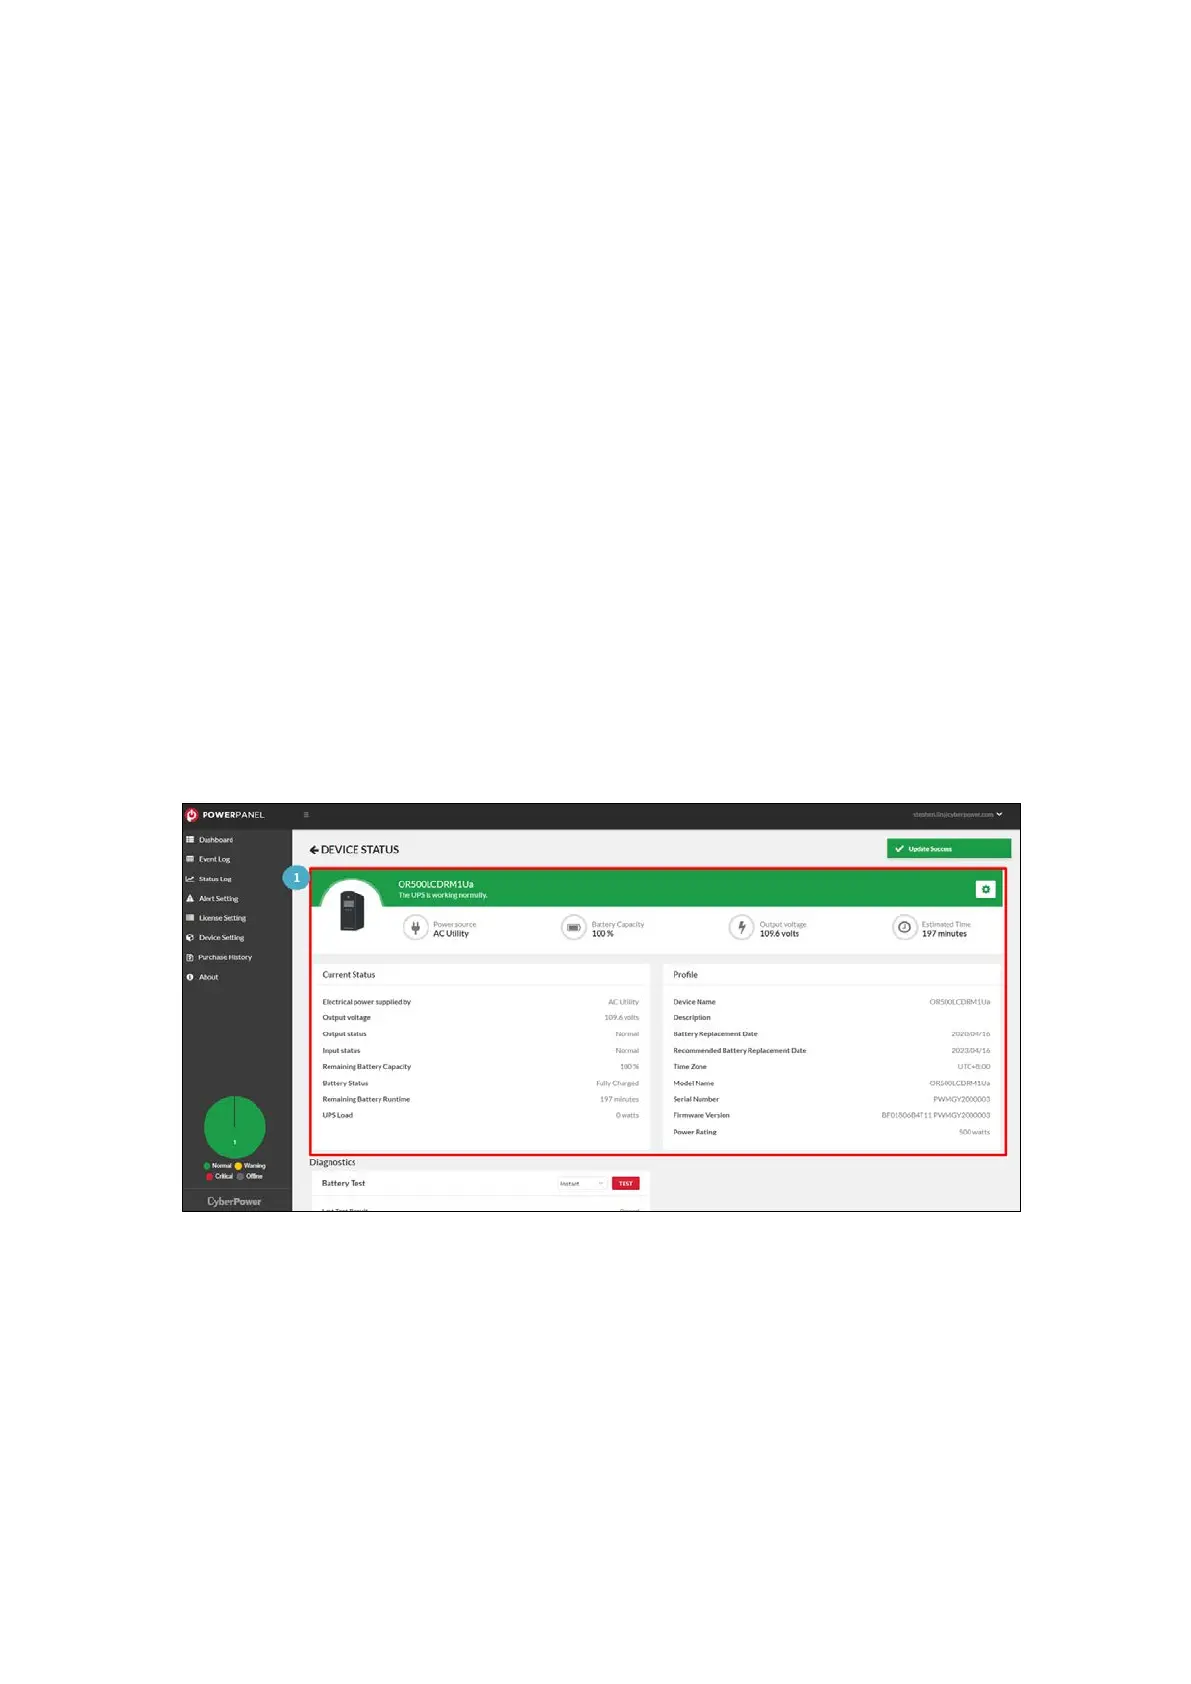
UPS to enter the
UPS detail page (
Figure 3.3). On the detail page, users can see the
UPS real-time status (❶ in Figure 3.3); view battery test section and
the event list displayed in the bottom area (❷, ❸ in Figure 3.3).
Figure 3.3 UPS Detail Page