19
Ta b le 3.1 The color definition of device status
Color Status
Green Normal status. The communication is normal and no
event happens.
Yellow Warning status. The warning event happens.
Red Warning status. The critical event happens.
Gray Communication lost.
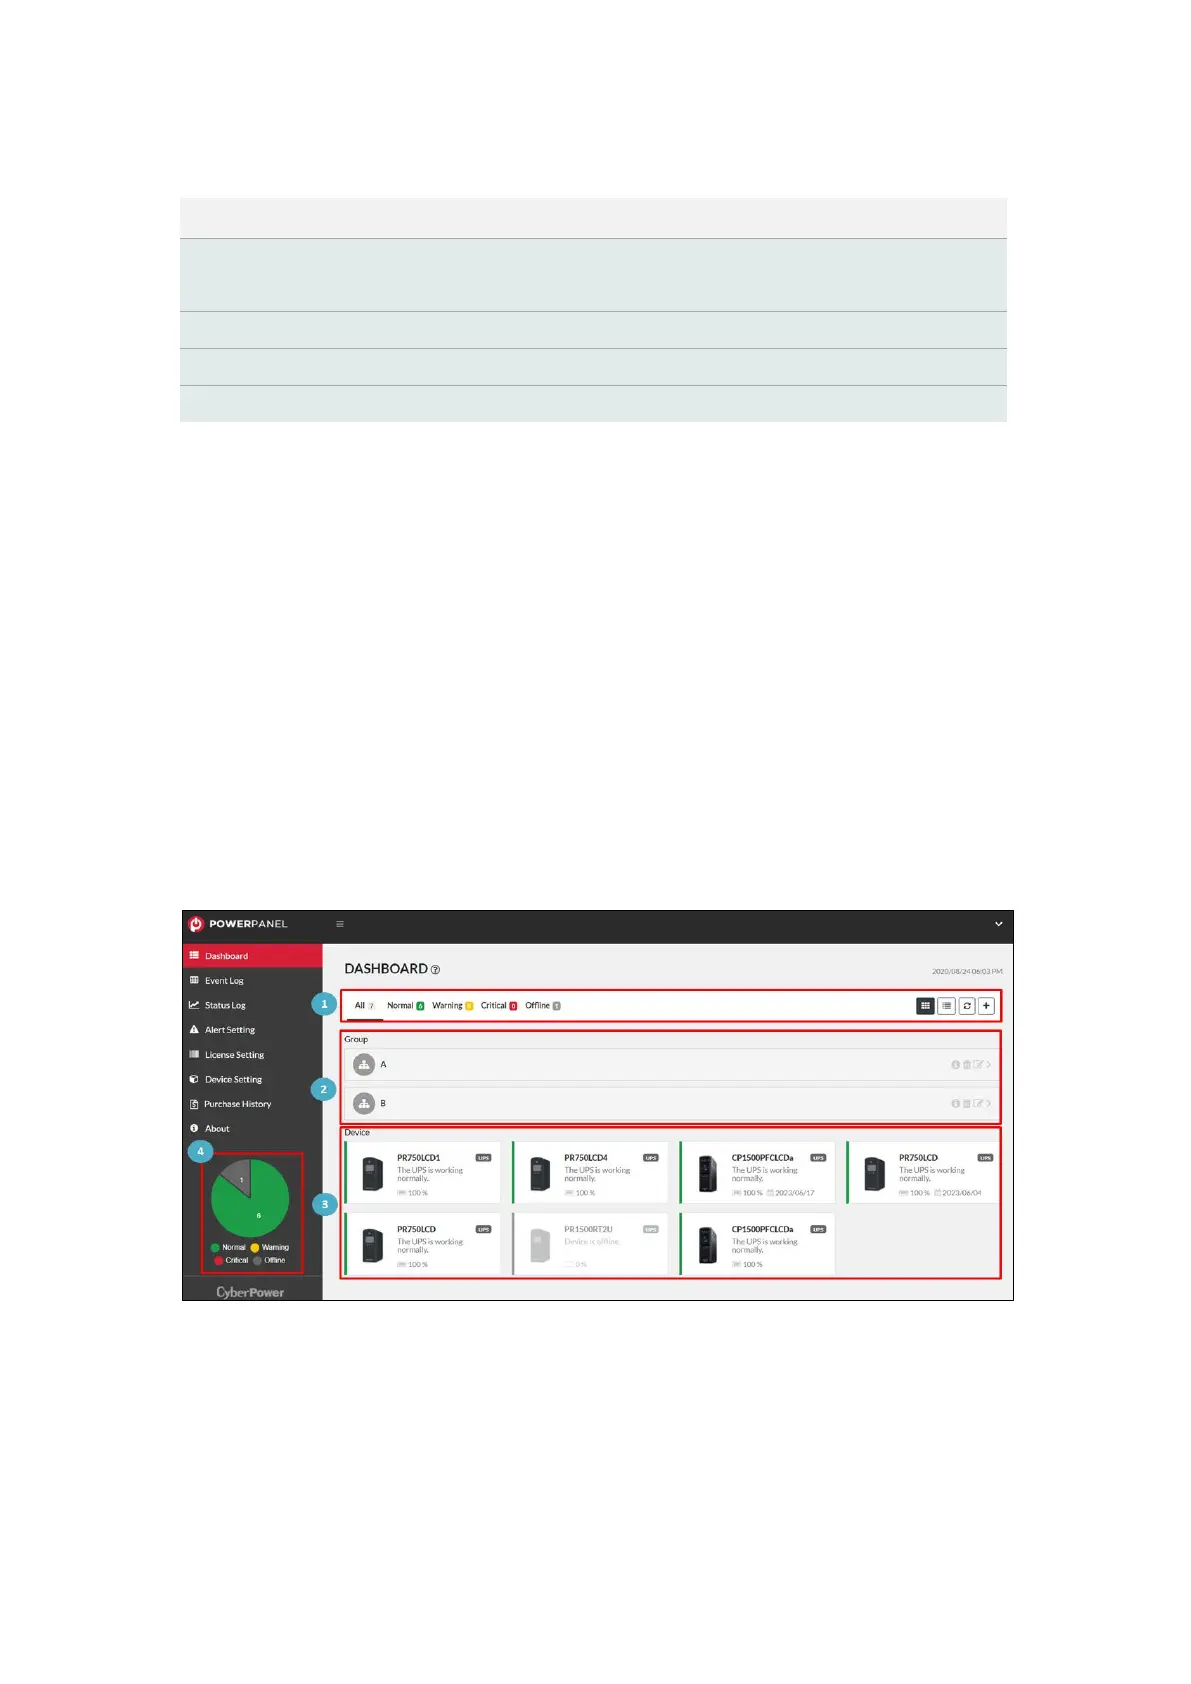
The dashboard is split into distinct areas. The upper area is the tool bar.
It includes the filter of the UPS status and the Add Group feature (❶
in Figure 3.2). The middle area is the UPS list displayed by the group
(❷ in Figure 3.2). The bottom area is the UPS list (❸ in Figure 3.2).
Each UPS is displayed in colors to show its status. Users can easily
spot a UPS that has a problem. At the bottom-left corner, the overall
statistics of the UPS are displayed (❹ in Figure 3.2).
Figure 3.2 Distinct areas in the Dashboard