4.2.3.2 AC Monitoring
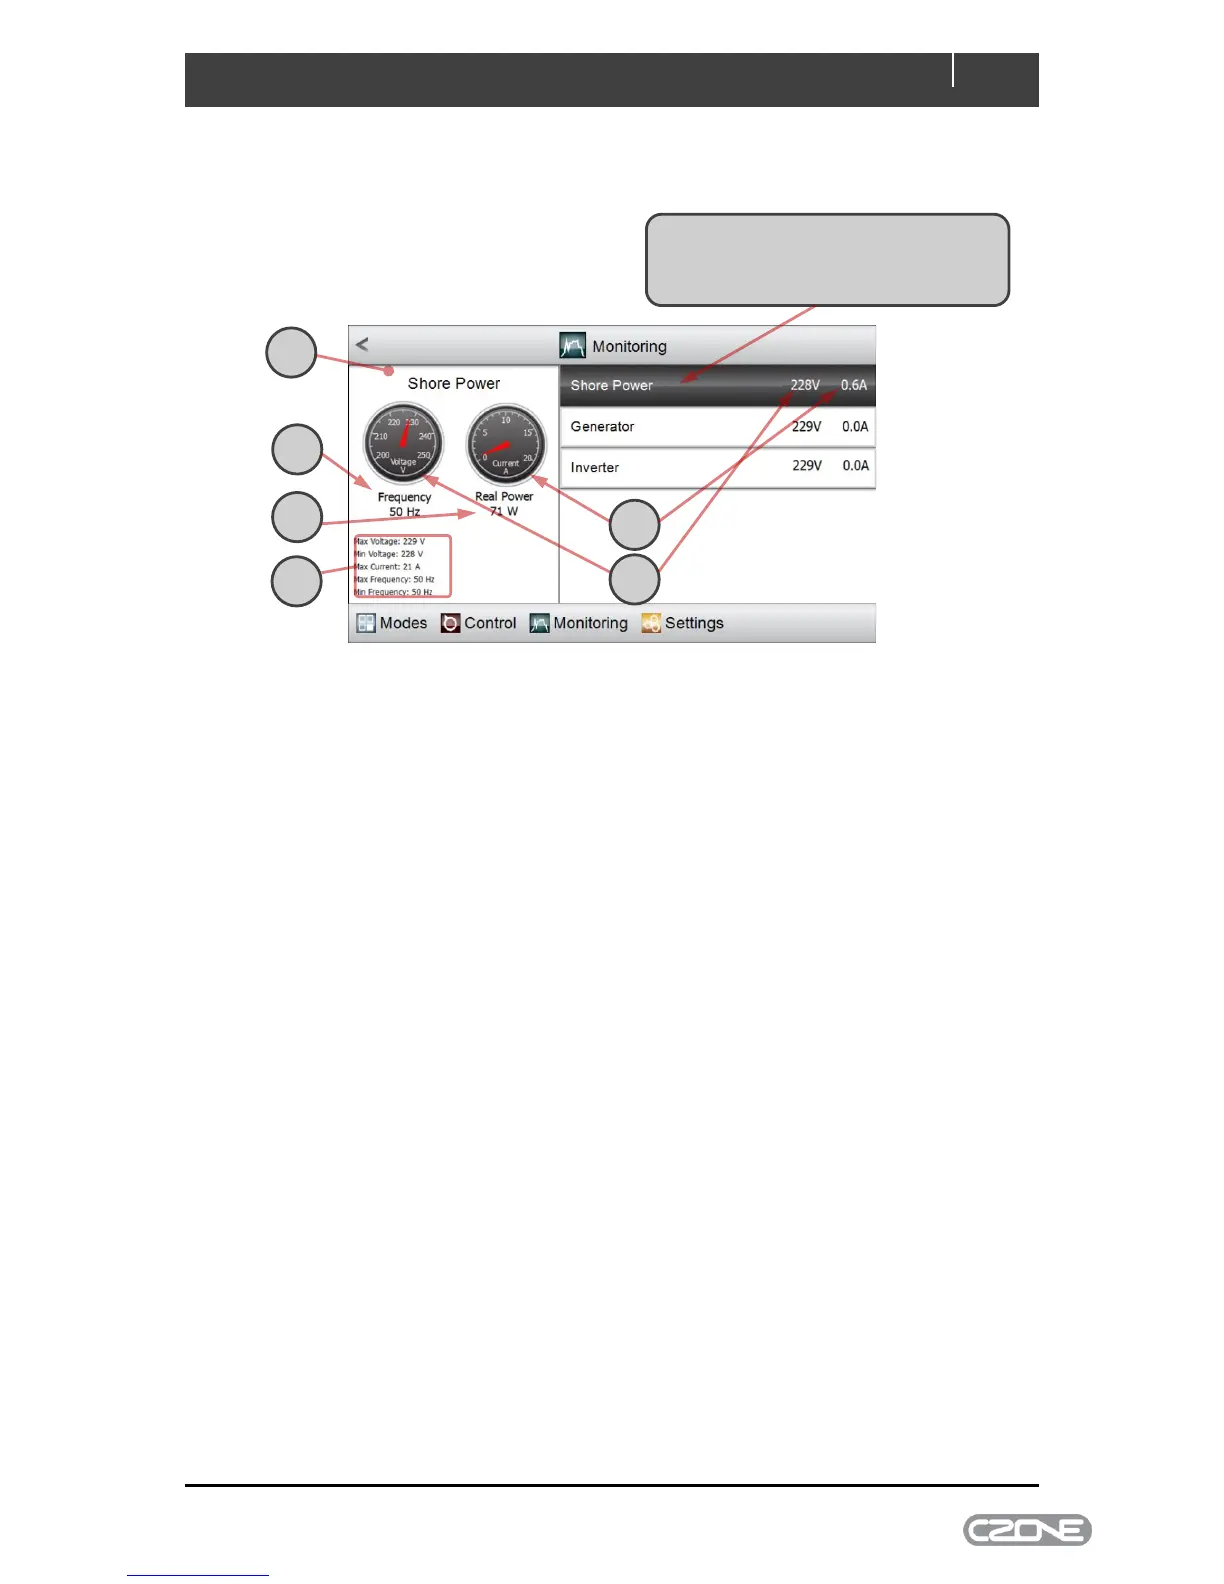
All AC Monitoring meters behave in the same way. An example is shown below:
A The status of the selected AC Mains source is detailed in the display panel
B The current drawn by all load groups supplied by the source is shown, to the right of the
highlighted name and using an analogue meter gauge
C The RMS voltage of the selected AC Mains source is shown, also in the highlighted region
and using an analogue meter gauge
D The frequency of the AC Mains source is shown
E The real power being supplied to all load groups supplied by the source is shown
F Worst-case recent performance of the selected source is shown, including:
maximum and minimum RMS voltages
maximum current draw by all supplied load groups
maximum and minimum supply frequency.
Click to highlight the AC source that you
wish to monitor. (In this example, only the
Shore Power source is supplying a load)