CO2-Recovery Plant 33 EN/2020
4.3 Mimic Diagram
The PLC display offers multiple ways to monitor and control the unit. On the main page you can
see the machine state, alarm information, production in kg/hr and you have buttons to control
the Unit or go to different views. Machine state and alarm panel will be visible on every display.
In Production History you can see graphs of the Unit’s production history for the last 24 hours.
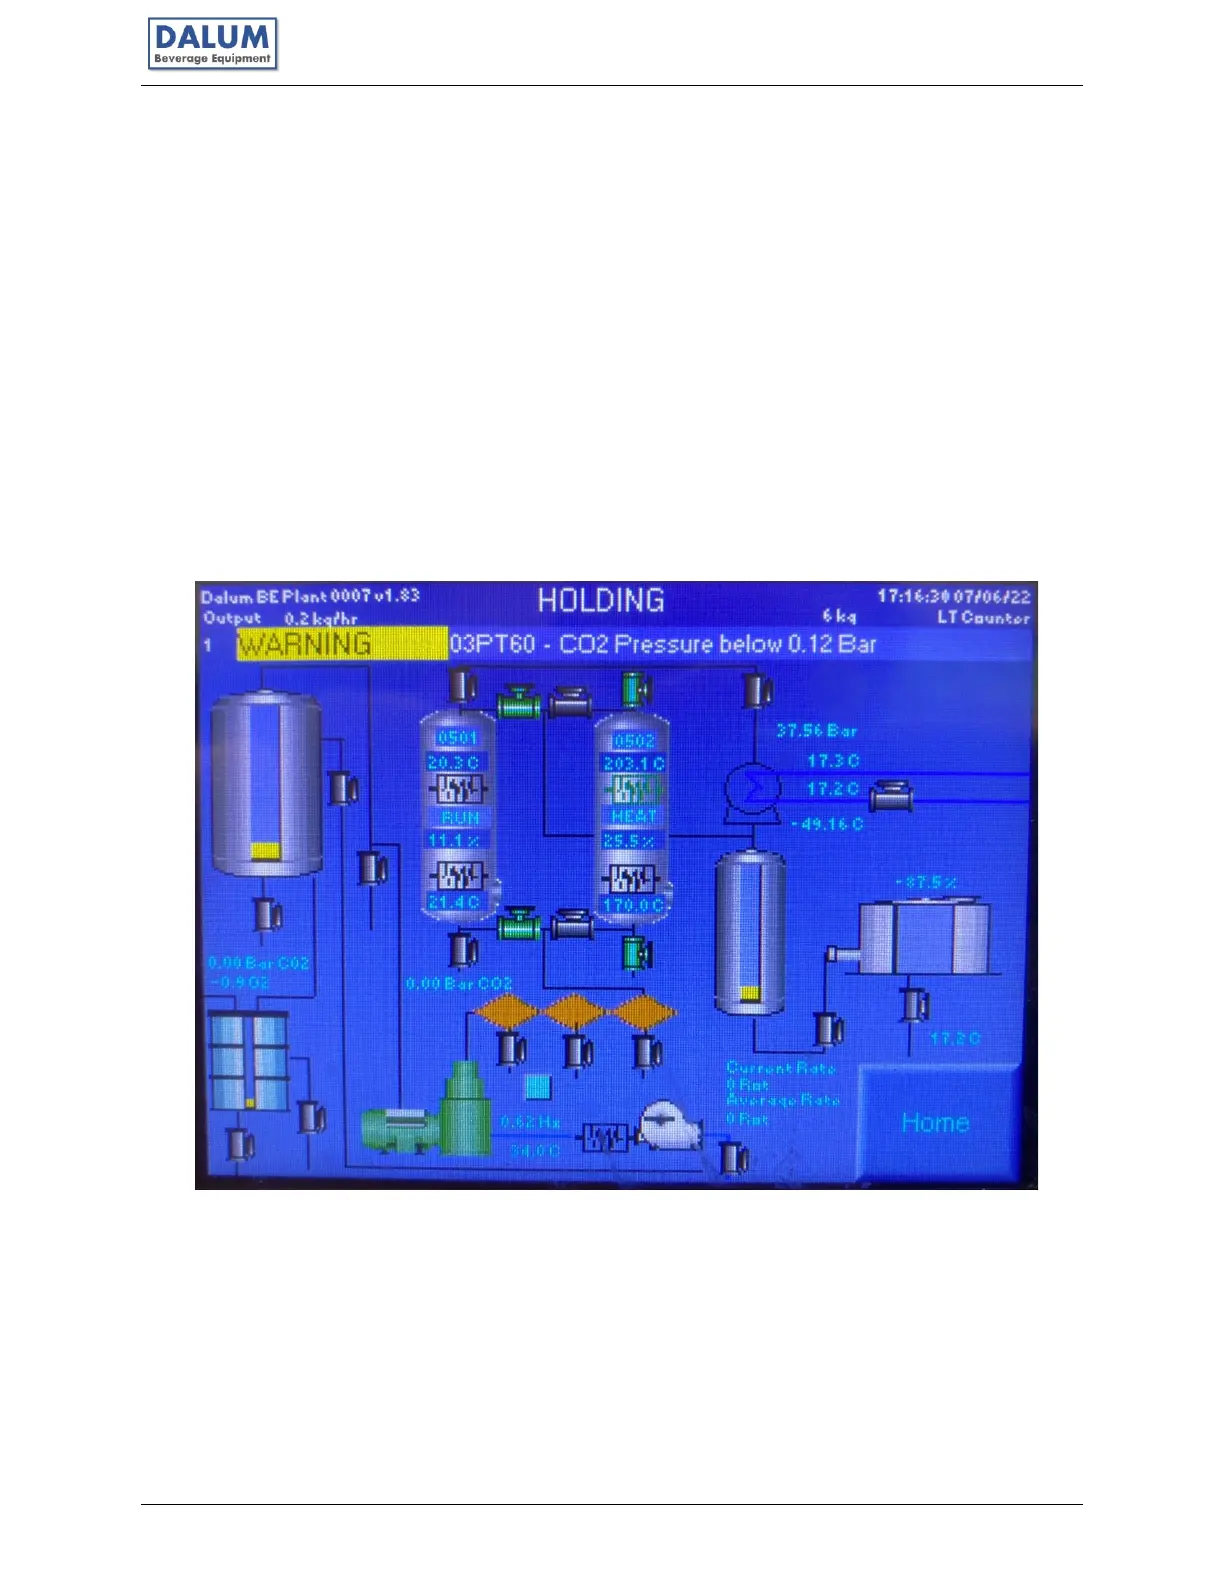
The Mimic Diagram shows an overview of the CO
2
Unit with all controllable parts displayed and
interactable. If a part is green, it is running in normal mode. If a part is blue, it is forced off. If the
part is red, it is forced on.
You can interact with the component directly from the mimic diagram, or you can click in the
vicinity of the component you want to interact with to zoom in on that area. There are 5
zoomable areas one for the compressor, one for the foam trap, one for the scrubber, one for the
dehydrators and one for liquefaction and storage tank. In each of the zoomed-in displays you
can see additional information for that specific section.