dCS 900E / 902E User Manual Manual for Software Versions 1.3x to 1.5x
dCS Ltd 12
th
June 2000
Manual part no: DOC0029021E1 Page 36 Document No: OS-MA-D0002-902.1E1
Contact dCS on + 44 1799 531 999 email to: more@dcsltd.co.uk
(inside the UK replace + 44 with 0) web site: www.dcsltd.co.uk
Noise Shaping
The dCS 900 & 902 use noise shaping
5
that is optimised to the F weighting
curve
6
. It does not affect signal frequency or transient response, but shapes the
frequency response of errors (Q noise, or truncation errors) so that they fall as
much as possible in the less sensitive part of the spectrum. For all the major
sample rates (32 kS/s, 44.1 kS/s, 48 kS/s, 88.2 kS/s, 96 kS/s) the noise shapers
have been individually optimised. The 1
st
, 3
rd
, and 9
th
shapes for 44.1 kS/s
agree well with Wannamaker’s published results
7
.
Noise Shaping adds more noise power, but because of the shaping it is
perceived as lower noise. There is a compromise to be drawn – as more
aggressive shaping is used, more noise is added, and less perceived
improvement occurs. In practice, things stop improving much above the 9
th
order. The increased real noise power can cause (small) clicks in editing, if this
is carried out after the shaping. For this reason, noise shaping should be used
as late as possible in the mastering process – we recommend recording at the
very highest possible sample rate and resolution, and only reducing either at the
latest possible minute.
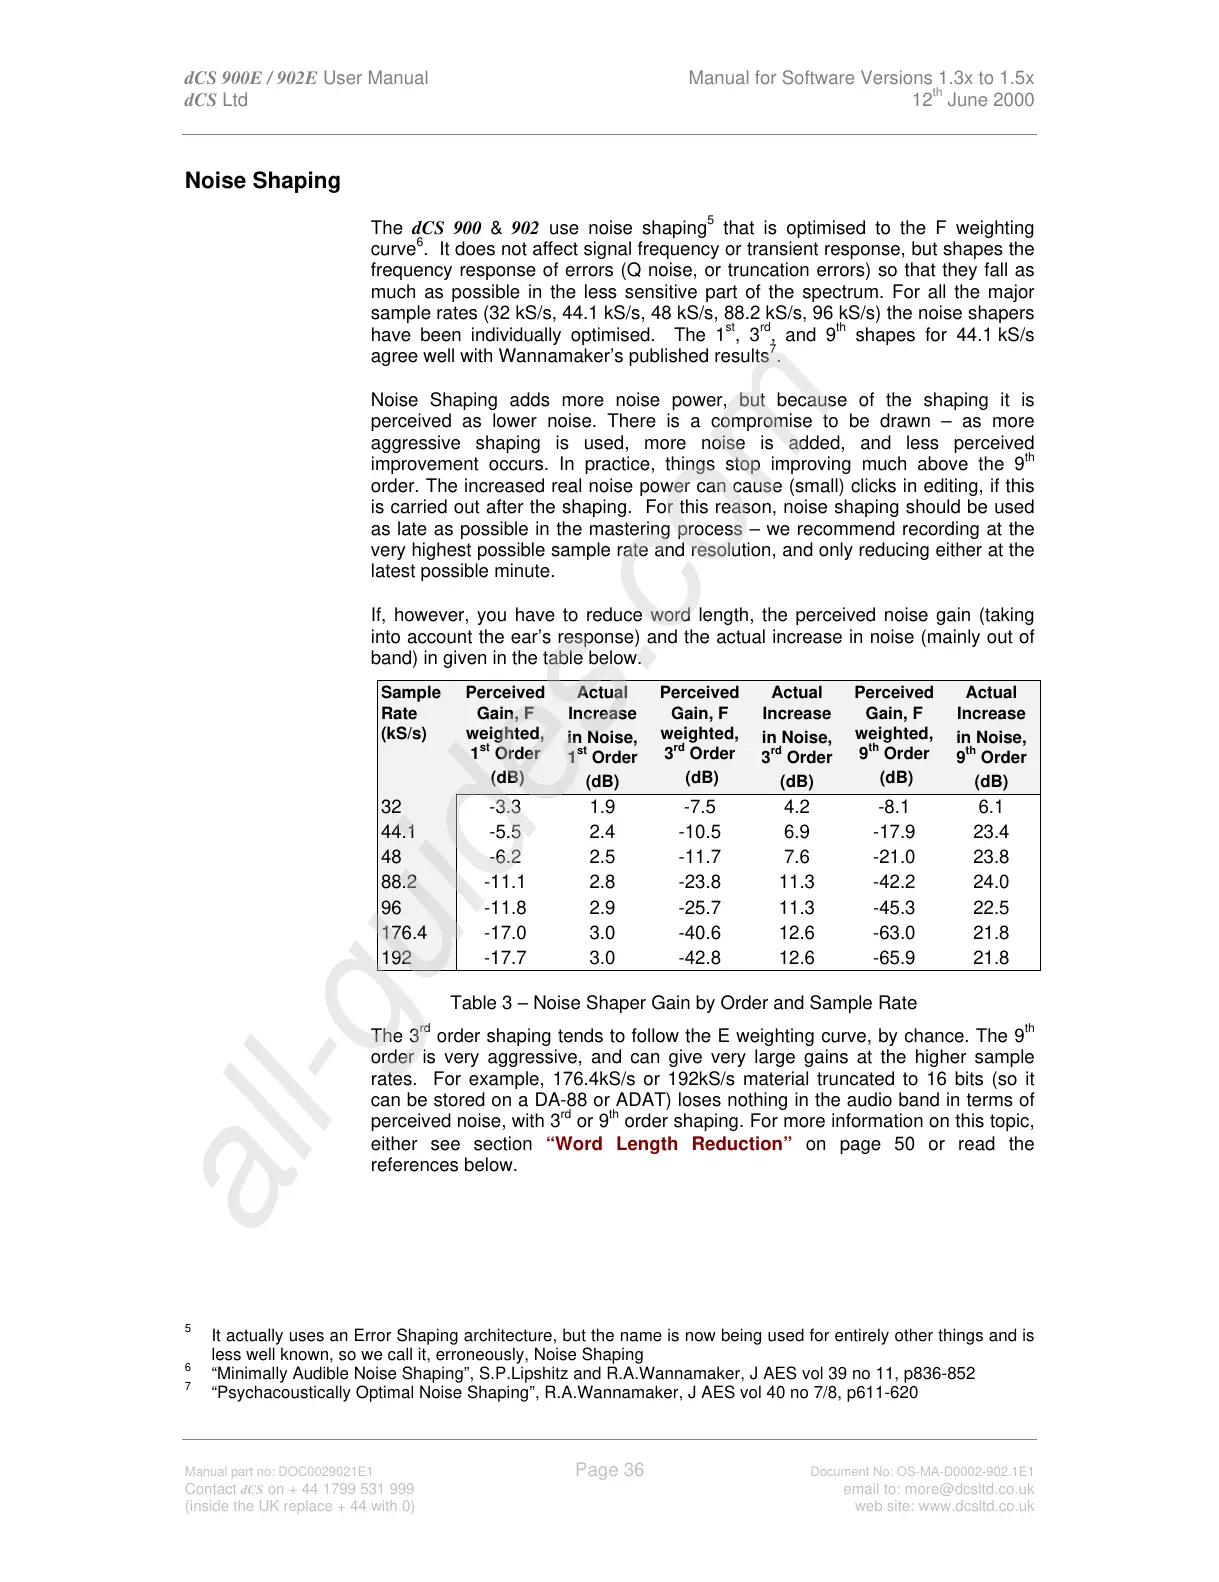
If, however, you have to reduce word length, the perceived noise gain (taking
into account the ear’s response) and the actual increase in noise (mainly out of
band) in given in the table below.
Sample
Rate
(kS/s)
Perceived
Gain, F
weighted,
1
st
Order
(dB)
Actual
Increase
in Noise,
1
st
Order
(dB)
Perceived
Gain, F
weighted,
3
rd
Order
(dB)
Actual
Increase
in Noise,
3
rd
Order
(dB)
Perceived
Gain, F
weighted,
9
th
Order
(dB)
Actual
Increase
in Noise,
9
th
Order
(dB)
32 -3.3 1.9 -7.5 4.2 -8.1 6.1
44.1 -5.5 2.4 -10.5 6.9 -17.9 23.4
48 -6.2 2.5 -11.7 7.6 -21.0 23.8
88.2 -11.1 2.8 -23.8 11.3 -42.2 24.0
96 -11.8 2.9 -25.7 11.3 -45.3 22.5
176.4 -17.0 3.0 -40.6 12.6 -63.0 21.8
192 -17.7 3.0 -42.8 12.6 -65.9 21.8
Table 3 – Noise Shaper Gain by Order and Sample Rate
The 3
rd
order shaping tends to follow the E weighting curve, by chance. The 9
th
order is very aggressive, and can give very large gains at the higher sample
rates. For example, 176.4kS/s or 192kS/s material truncated to 16 bits (so it
can be stored on a DA-88 or ADAT) loses nothing in the audio band in terms of
perceived noise, with 3
rd
or 9
th
order shaping. For more information on this topic,
either see section “Word Length Reduction” on page 50 or read the
references below.
5
It actually uses an Error Shaping architecture, but the name is now being used for entirely other things and is
less well known, so we call it, erroneously, Noise Shaping
6
“Minimally Audible Noise Shaping”, S.P.Lipshitz and R.A.Wannamaker, J AES vol 39 no 11, p836-852
7
“Psychacoustically Optimal Noise Shaping”, R.A.Wannamaker, J AES vol 40 no 7/8, p611-620