8-21
CH 8/ Reports
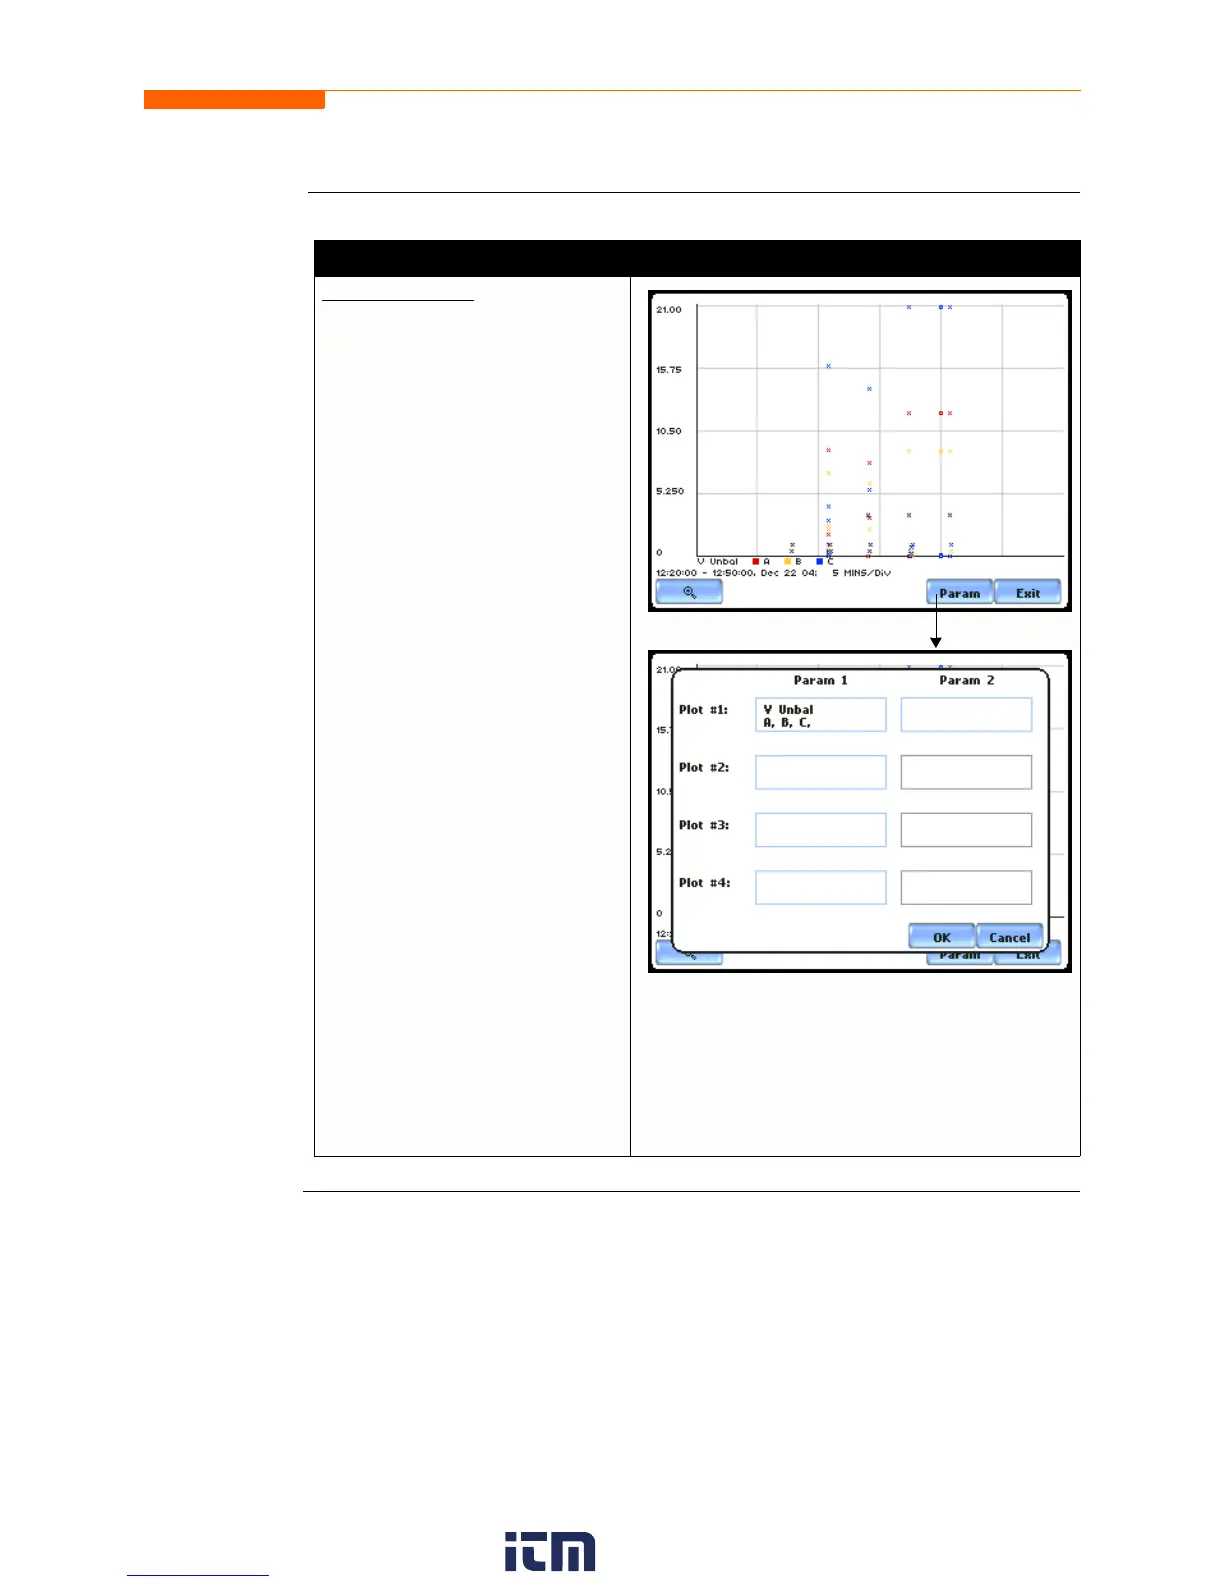
Parameter data
plot (continued)
Continued on next page
Action... Result...
FOR EXAMPLE:
Once View Graph is selected,
coordinates for V RMS
Imbalance event are displayed on
screen.
NOTE: Imbalance is the rms
deviation calculation per channel
if the instrument is in Standard
PQ Mode. It will display the
ANSI definition of unbalance for
channels A, B and C if the
selected monitoring mode is other
than EN50160. When monitoring
under EN50160 mode, Imbalance
will be a simple value as per IEC
definition, defined as the sum of
negative sequencing components
divided by the sum of positive
sequencing components (similar
to meter readings under Meter
Mode).
•Press the Magnify button to
use the zoom features and to
view plot coordinates in detail.
•Press Param to show the
trigger parameter and channel/s
displayed on screen.
•Press Exit to return to the
Status screen.
MARK610
MARK611
w ww . . co m
information@itm.com1.800.561.8187