2388-MANUL-V10.00.00-UTP2 Operating Manual
Page 47 of 74
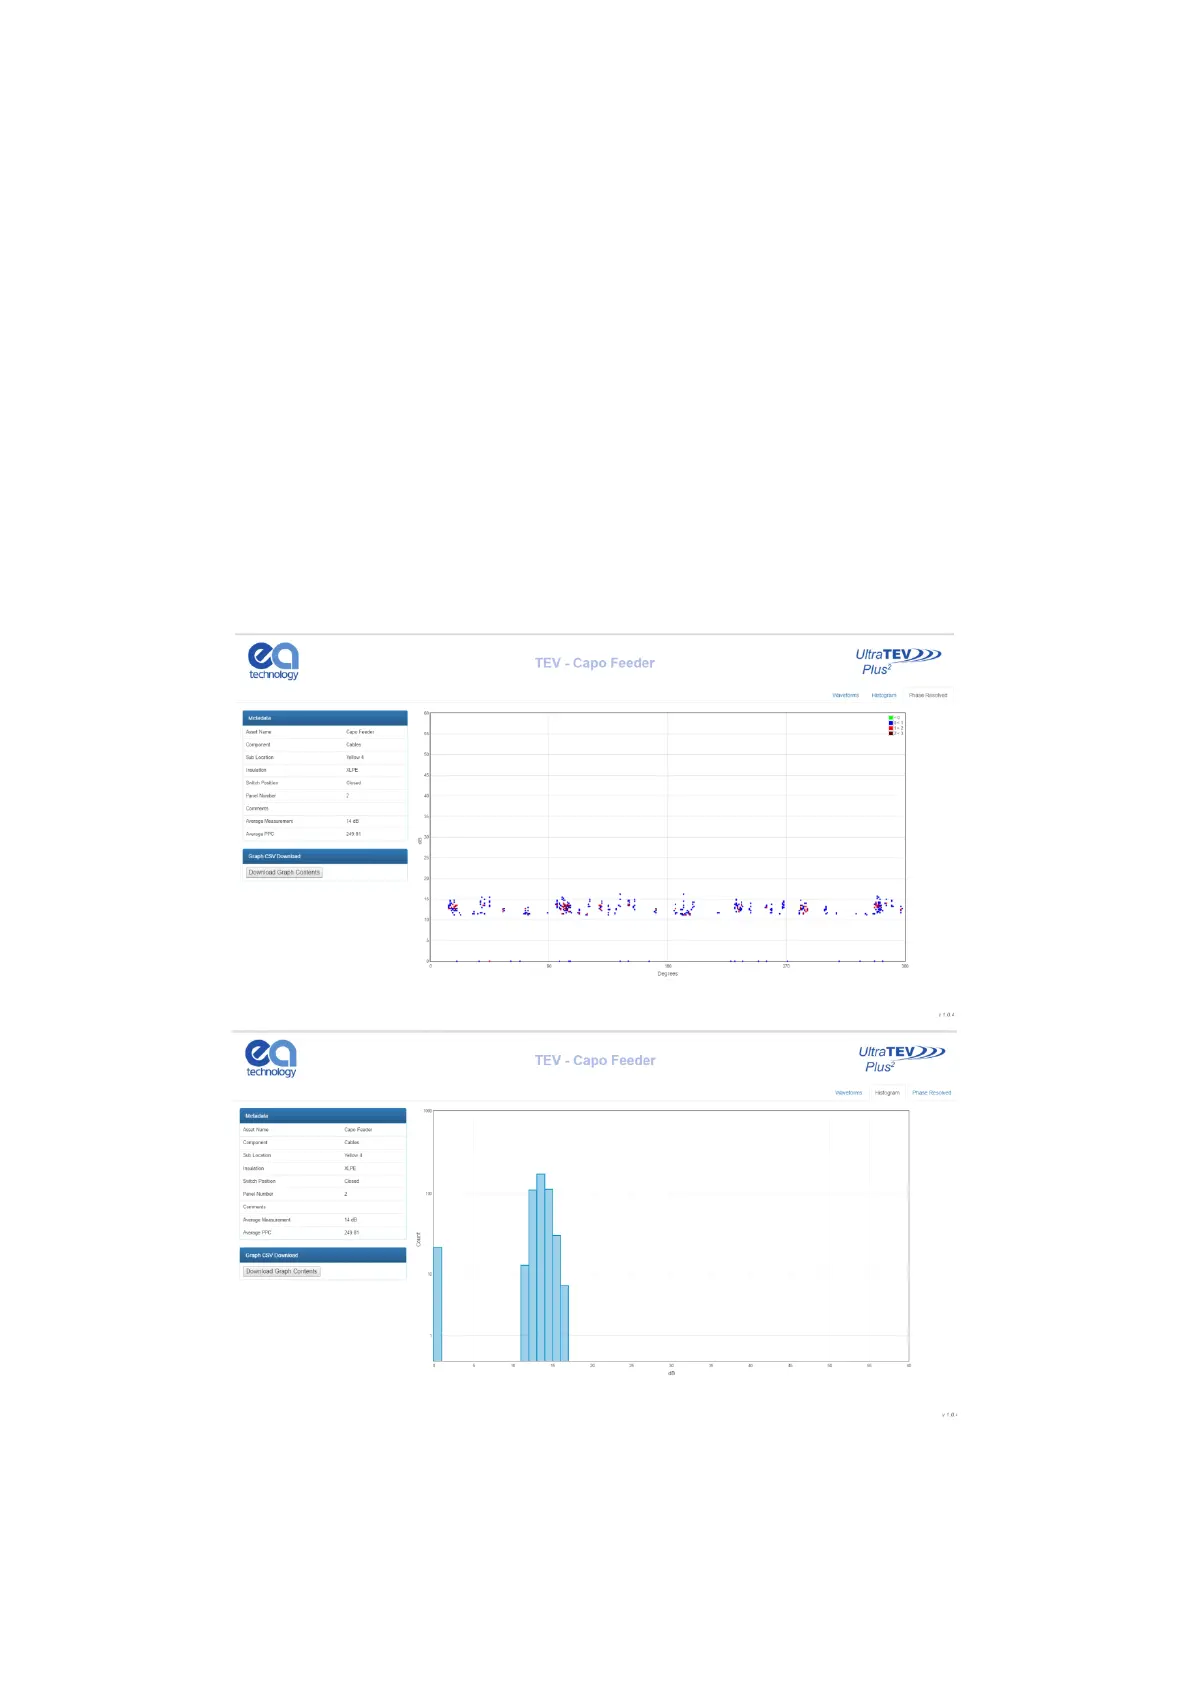
3.17.6 TEV & Cable PD Analysis Screen
Both TEV and Cable PD recorded data share the same suite of analysis screens. Once a TEV or Cable PD
measurement has been selected from the index page a new tab will open in the browser displaying the analysis
page corresponding to the measurement selected. Multiple individual analysis pages can be opened
simultaneously in this way to aid comparison.
The TEV and Cable PD analysis pages both have metadata regarding the current measurement on the left side
of the page, with another button beneath to download the raw dataset for each graph to CSV. The chart
displayed on each page can be changed between Waveform, Histogram and Phase Resolved by clicking the
tabs in the upper right hand corner.
Both Phase Resolved and Waveform graphs are able to be zoomed by clicking and dragging on the graph area;
the original zoom level can be returned to by clicking the respective graphing tab in the upper right hand corner.
Hovering the mouse over a point/bar on each respective graph will produce a tooltip with information regarding
that event. On the Phase Resolved graph a legend can be seen on the upper right of the graph area, indicating
the scaling of colours for each point.
When the Waveforms tab is opened, a new control will appear beneath the metadata on the left. The ‘Waveform
Control’ section allows navigation through the waveforms collected using the up/down arrows next to the
waveform number. The ‘Show All’ button can be used to show all waveforms on the same graph.