2388-MANUL-V10.00.00-UTP2 Operating Manual
Page 61 of 74
4.4.3 Operation
Once the UHFR1 is connected, access the UHF functionality by pressing the UHF icon from the UTP2 home
screen.
• The normal TEV measurement screens are available for use in UHF mode.
• In addition, there is also a 3D Phase Plot screen and a Spectrum screen
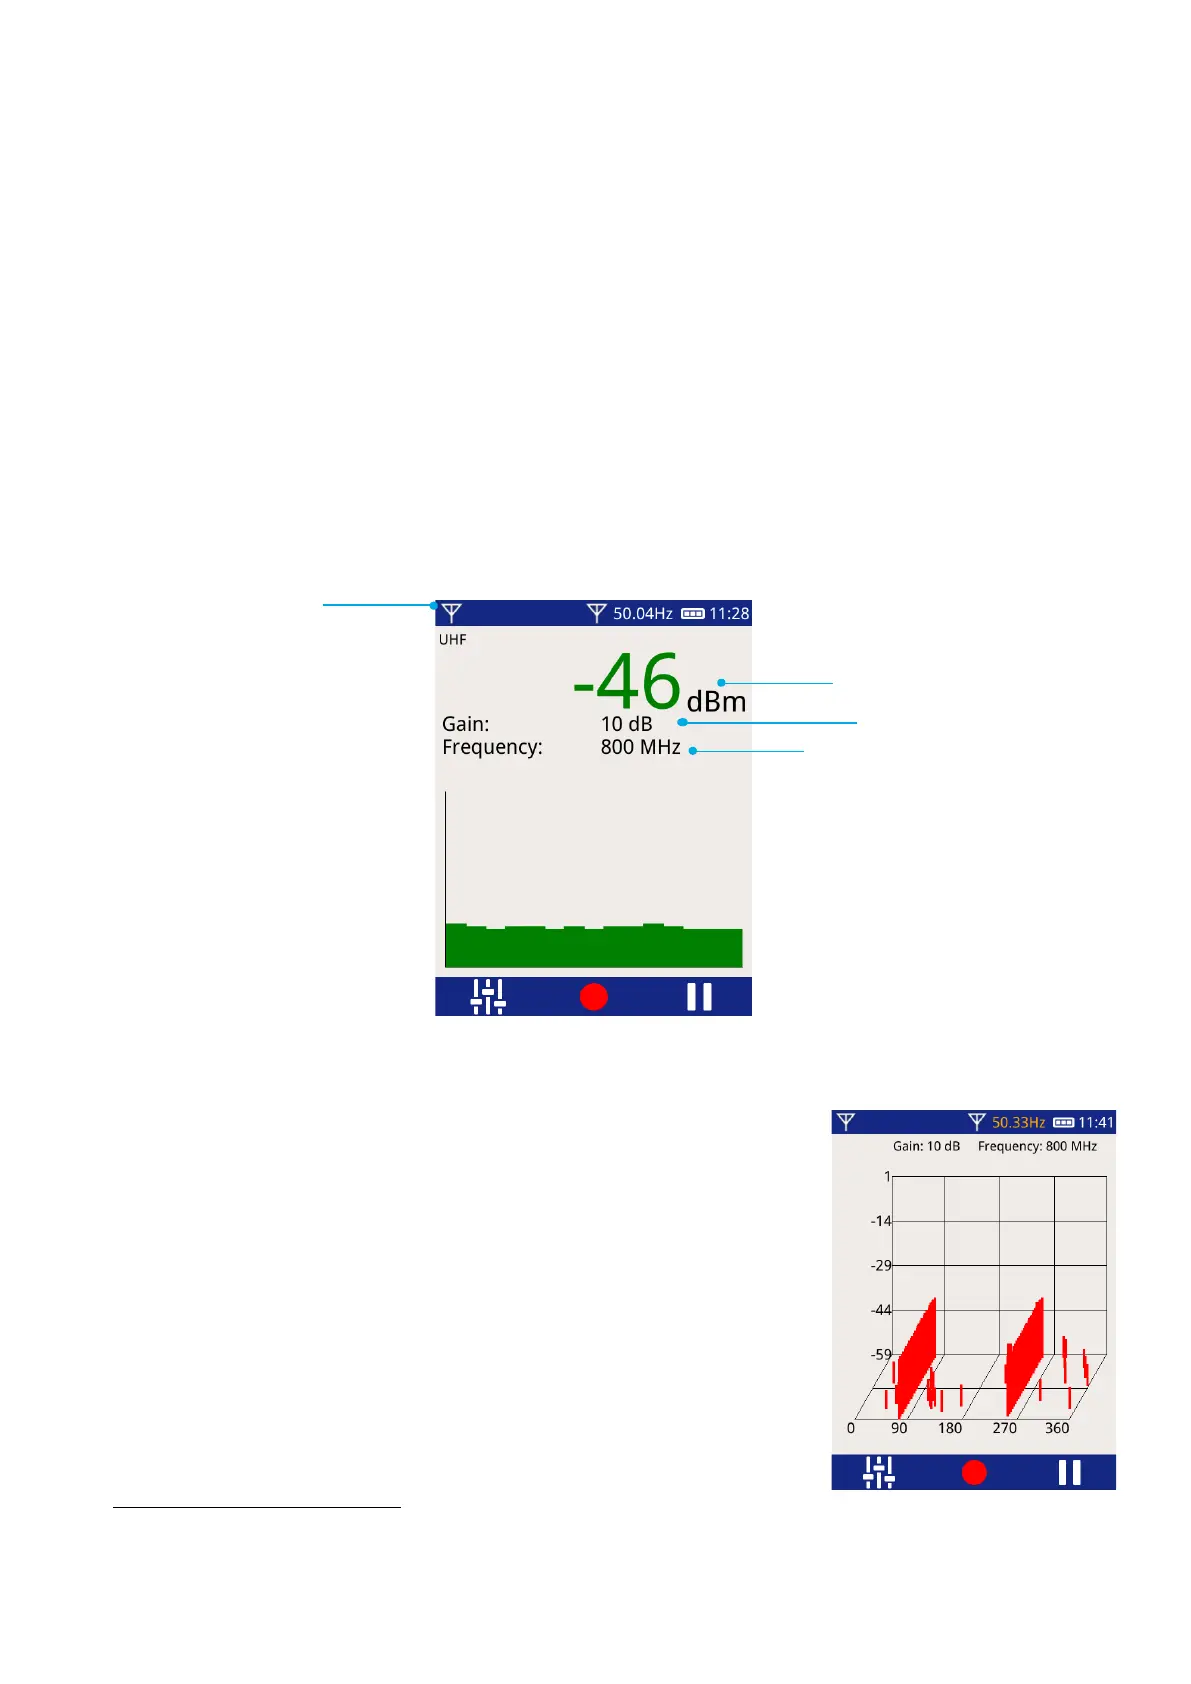
4.4.4 UHF Measurement Screens
The measurement screens are adapted for UHF measurements:
• The amplitude measurements are shown in decibel-milliwatts (dBm)
.
• The selected gain and tuning frequency are displayed (in Narrowband mode only)
• The audio source icon will show the UHF symbol if this audio source is selected
4.4.5 3D Phase Plot
The 3D Phase Plot screen shows a phase-resolved view of the received signal
over time.
• The phase plot for each mains cycle is plotted.
• The plot continually updates with the most recent cycle shown at the
front of the graph.
This screen can be used to determine whether a PD source is continuous or is
changing over time.
This is a logarithmic scale comparing the received power to 1 milliwatt (1 mW). The value is negative when
the power received is less than 1 mW.
Selected tuning
frequency