ECP2010 / ECP2010H
40 / 68
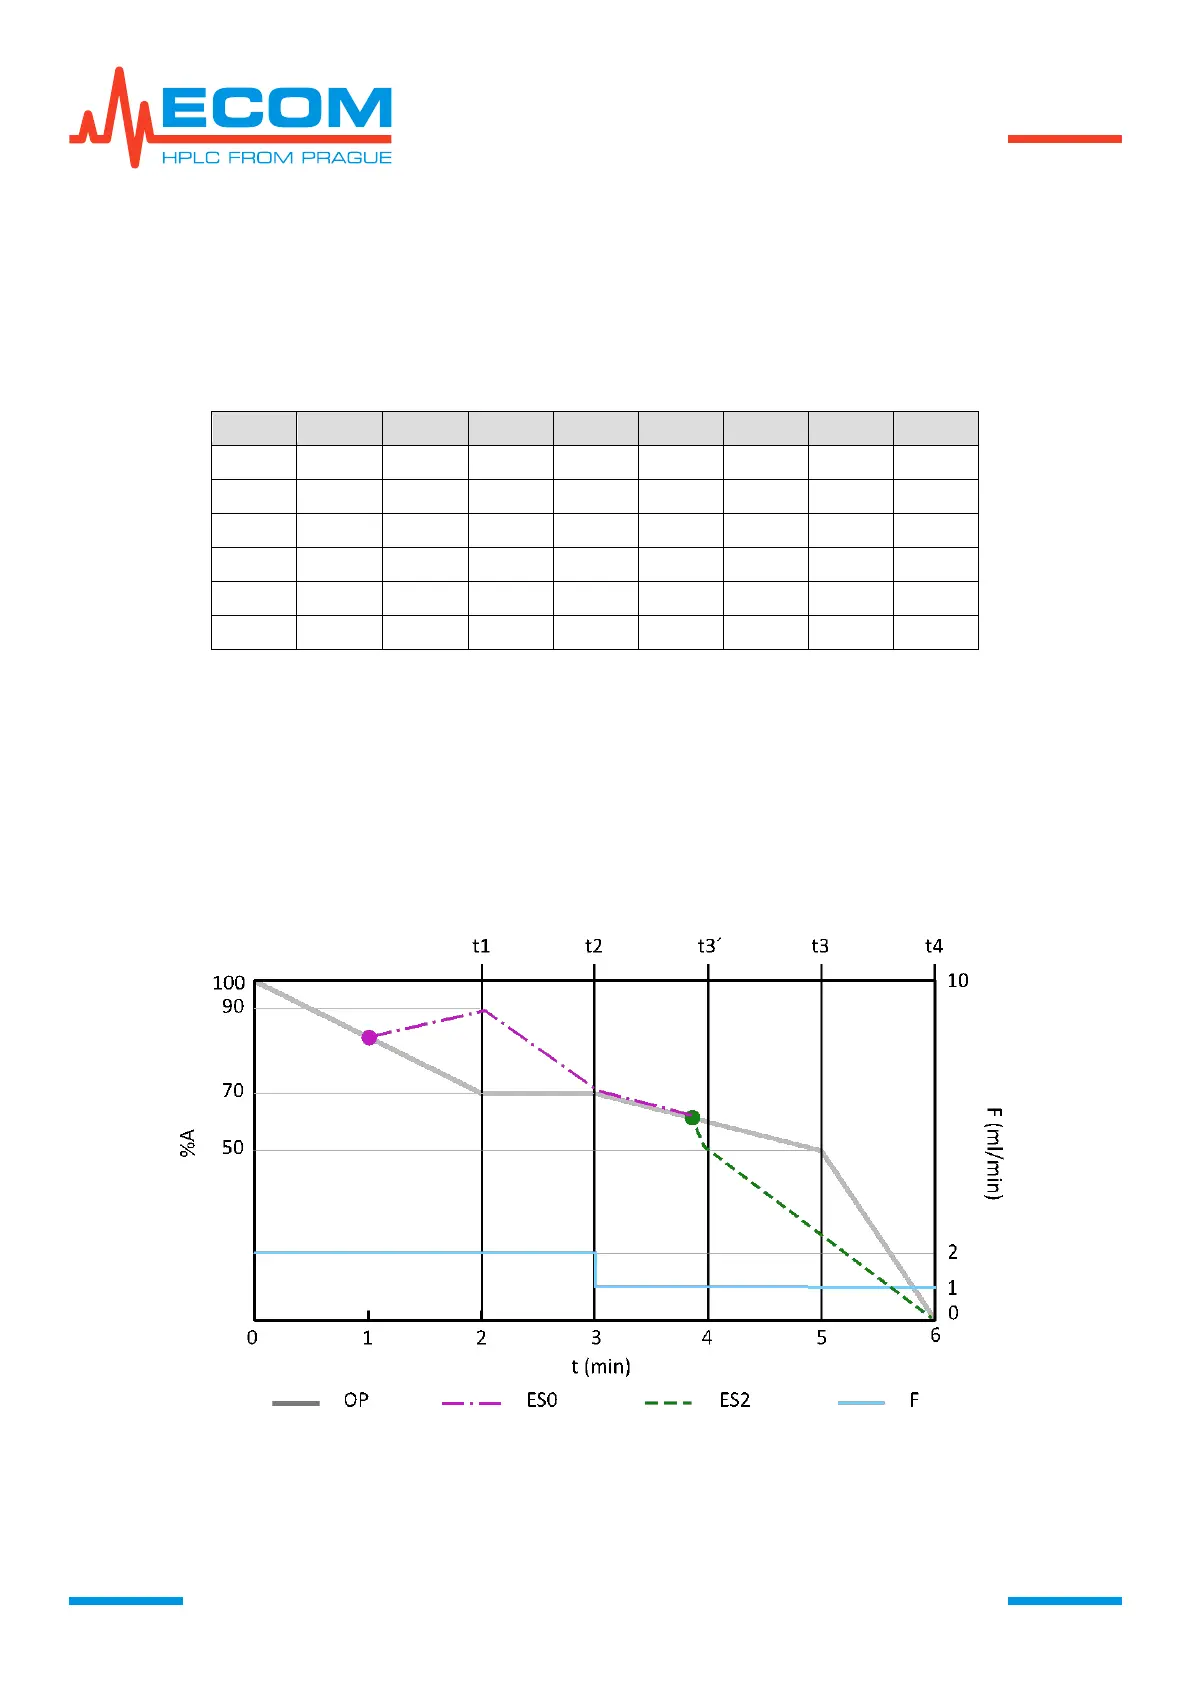
Graphic Presentation of Modifications in Running Step.
In TIME TABLE is stated default program setting. During running program will be done two
modifications. First modification is change of gradient concentration, proceeded during
step 0 from %A = 70 to %A´ = 90. Second is modification of start time of step 3, done during step 2
from t3 = 5 min to t3´= 4 min.
TIME TABLE
The course of original program in graph below is representated by curve OP. After first
modification during step 0 is the course represented by curve ES0. After second modification
during step 2 is the course represented by curve ES2. Flowrate is displayed by curve F. Start times
of steps are illustrated by line tn.
In time 1:00 is changed gradient concentration, shown by change of curve direction from the
point of change. Until the end of step 0 is set desired concentration.
In time 3:53 is changed start time of step 3 t3´, shown by change of curve direction from the
point of change and with concentration setting until the end of step 2 according to the table.
GRAPHICAL RECORD OF PROGRAM AND ITS MODIFICATIONS
6.3.4.4. Exit Program Mode
Leaving program mode can be done by pressing ENTER. Pump gets to status, when it is not
controlled by any program. Unit keeps setting from last used program.