Maintenance (continued)Table 2-2:
Daniel MeterLink utility Diagnostics Action(s)
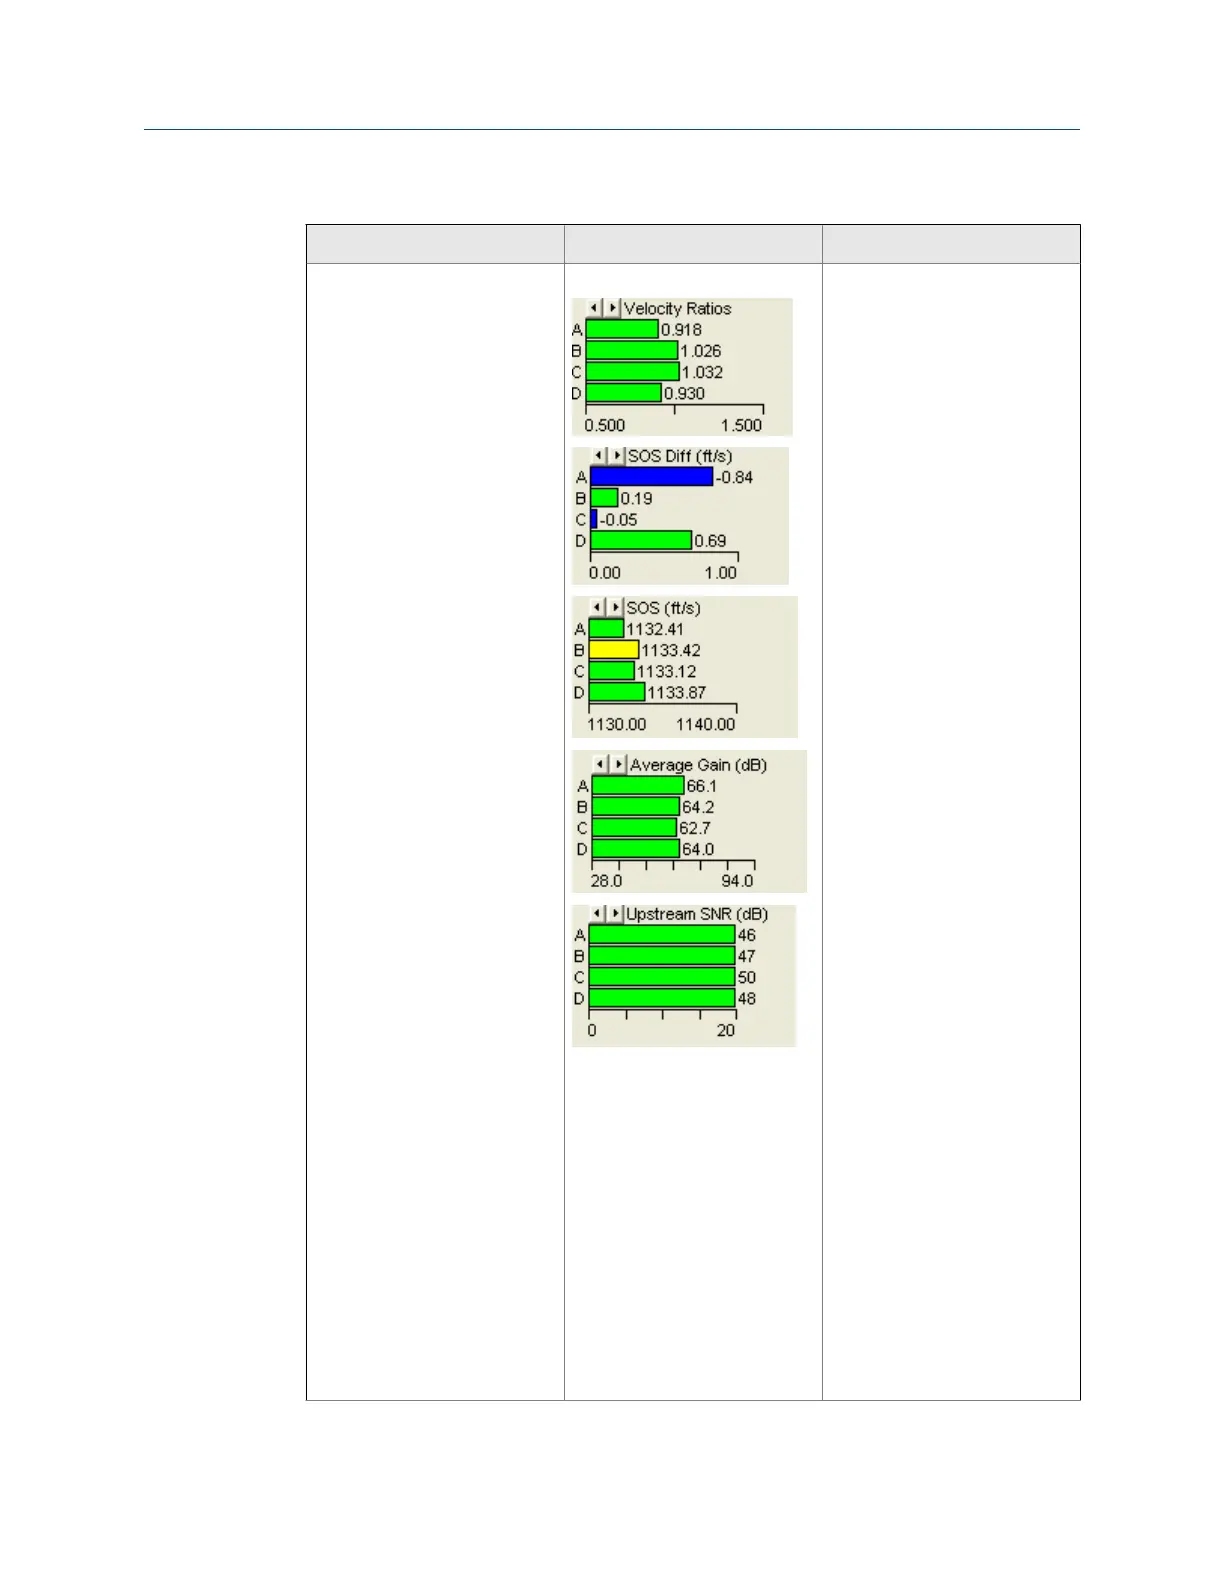
Meter Monitor (Detailed) view • Flow Profile • Flow profile velocity for me-
ters with four Chordal paths
- Chords A and D shown on
the Bar graph should be of
equal lengths and at 5 ft/s
should be 0.89 and Chords
B and C should be 1.0 indi-
cating a good flow profile.
• If the velocity range is
greater than a 10% differen-
tial between chords, a deg-
radation in the symmetry is
indicated by a change in
the flow velocity for the
chord and the measured
SOS. A chord that causes
the spread for the Speed of
Sound to vary more than
0.35% of the Average
Speed of Sound, the bar for
that chord turns yellow.
• Clicking one of the arrows
at the top left of the graph
will change the chart to
SOS Differences from the
average meter speed of
sound. This provides a
quick indication on how
much spread in speed of
sound is between the
chords. Negative values are
shown in blue.
• Compare Gains and Signal
to Noise (SNR) ratios deci-
bel values with the values in
the Maintenance log In-
spection report from the
meter flow calibration.
• Check chord average signal
amplitudes with the meter
baseline values in the Main-
tenance log Inspection re-
port.
• The meter may not be in
measurement mode or
there are too few operating
chords.
Troubleshooting
Maintenance and Troubleshooting manual 29
 Loading...