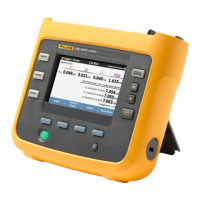
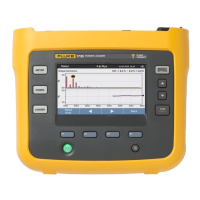
Energy Logger
Function Selection Buttons
29
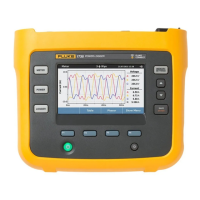
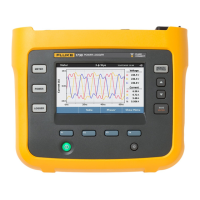
Push (Graph) to display the measured values in a
chart. The table on the right side of the screen shows the
highest and lowest value of the graph measured with the
average calculation interval. Triangular indicators point to
the measurement value.
Energy
Note
Not available on load studies without a nominal
voltage.
Determine the energy consumed/delivered since the
logging session has been started.
Parameter
Forward/Reverse
Energy
Total
Energy
Active Energy (Wh) +/+ +
Apparent Energy (Vah) -/- +
Reactive Energy (varh) -/- +
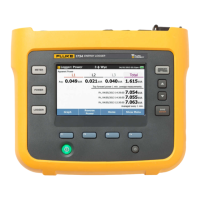
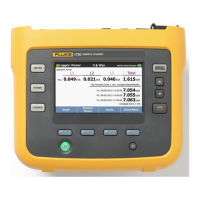
The Demand screen shows the values for:
• Consumed energy (= forward energy) in Wh
• Maximum Demand in W. Maximum demand is the
highest active power measured over the demand
interval and is often part of the contract with the
electricity supplier.
• Energy cost. The currency can be configured in
instrument settings. See page 32 for more information.
Details
The details screen provides an overview of the logging
setup. During an active session or when reviewing an
already completed session, the description can be
modified with the Edit Setup touch target. Once a session
is complete, you can recalculate the total energy costs with
a new configuration that has a different energy cost/kWh.
Push View Configuration to review the measurement
configuration for the logging session.
Memory/Settings Button
In this menu you can:
• Review the data from completed logging sessions
• Manage the data memory
• Copy measurement data to the USB flash drive
• Erase measurements
• Make adjustments to the instrument settings
Logging Sessions
The list of stored logging sessions is available with
(Logging Sessions). Push to move the screen
highlight to the logging session of interest. Additional
information such as start and end time, duration, logging
description, and file size are shown.
1. Push to review the logging session. See View
Logging Sessions for more details.