Introduction and Specifications
Specifications
1
1-7
Stability
Stability for a given period of time is defined as the output uncertainty minus the
calibration uncertainty at the 99% Confidence Level. When the output voltage is
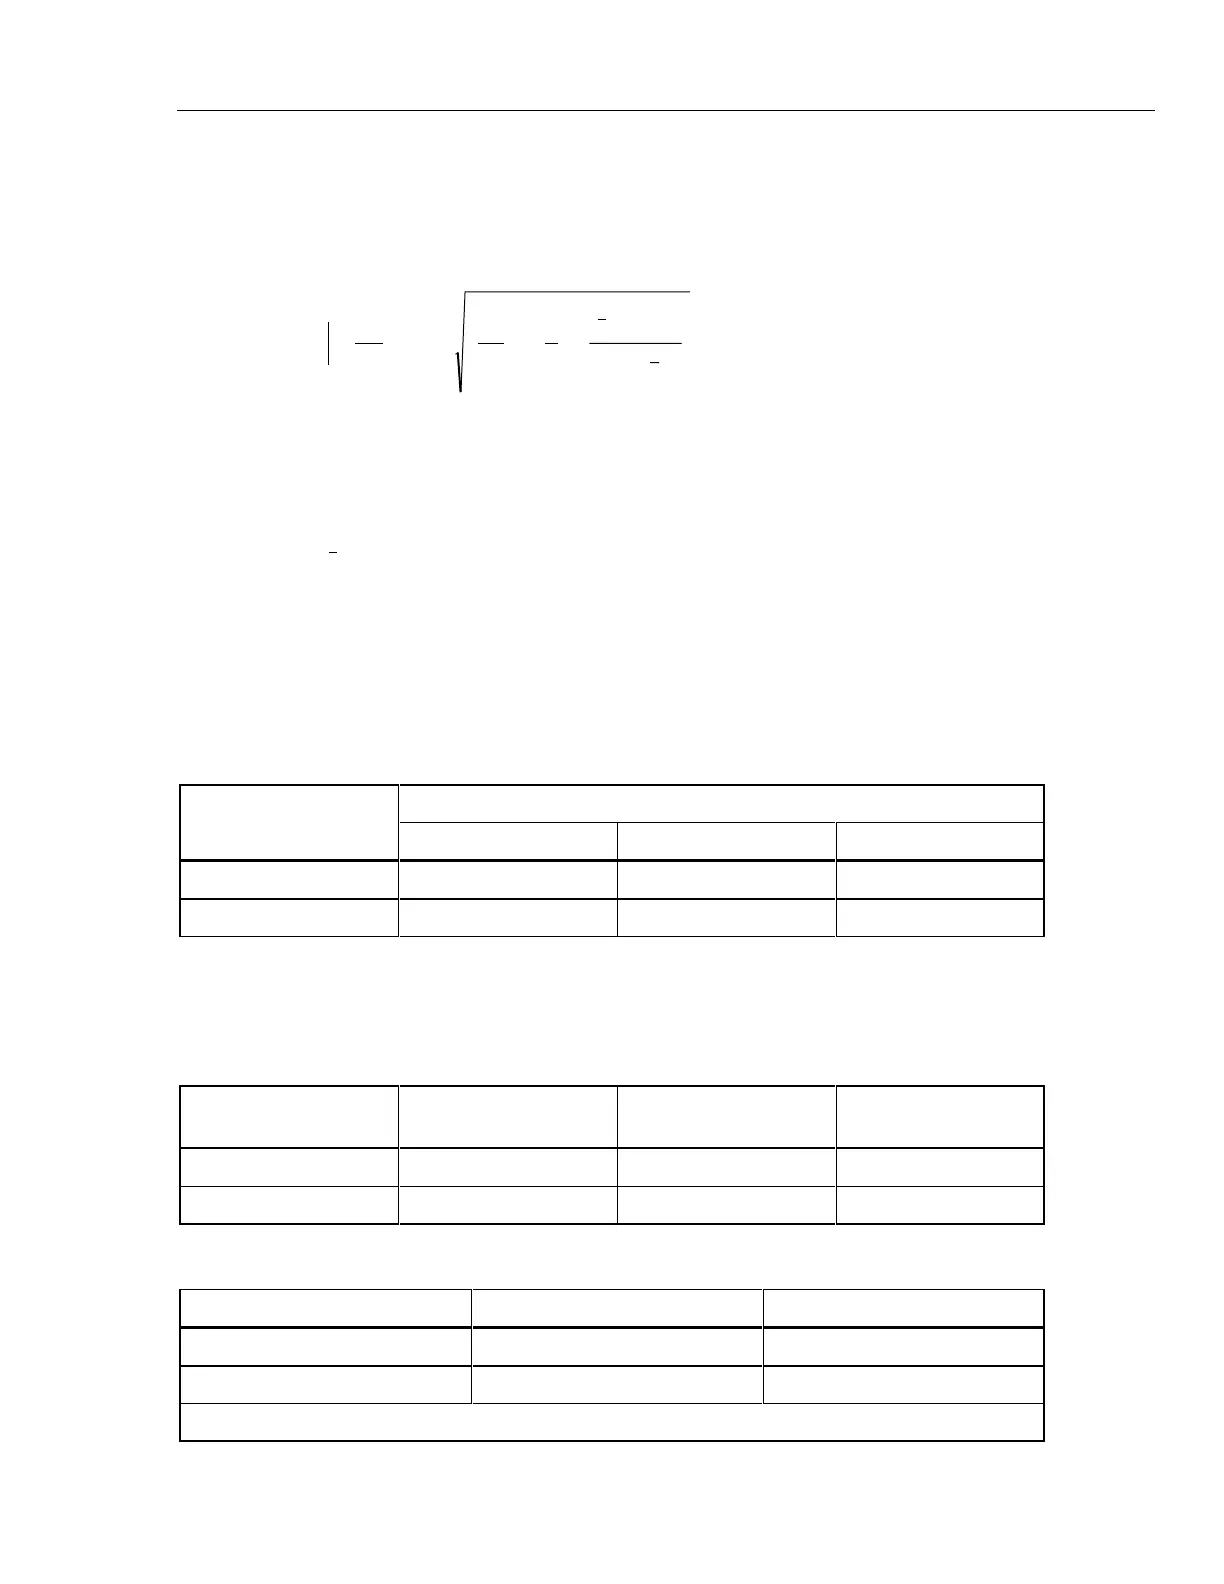
characterized by a regression model, stability is given by the following equation:
()
b
P
365
2.65S
1
S
ra
S
1
1
n
2
X
j
x
2
+
+
+
+−
−
∑
2
1
xPx
where b = slope of regression in ppm/year
S
1
= standard deviation about the regression (SDEV)
S
ra
= SDEV of data filtered with 7-day moving average filter (MAF)
P = Period of time under consideration in days
x = mean time for regession data
n = 180 period (typically 2 meassurements per day)
Xj = jth period
X
1
= time at beginning of data
Each data point for the computation of the regression parameters is the average voltage
of 50 readings taken in a 50-second measurement period.
Stability for the 732B outputs at 23 ±1°C is specified as follows:
Output Voltage
Stability (± ppm)
30 Days 90 Days 1 Year
10V 0.3 0.8 2.0
1.018V 0.8 NA NA
Noise at the Output Terminals
Output noise is specified for both day-to-day observations and for short-term
observations. The former is given by the standard deviation of a 90-day regression
model. The latter is in terms of its rms value in a bandwidth as follows:
Output Voltage S
1
(± ppm) S
ra
(± ppm)
Noise (0.01 Hz to 10
Hz (± ppm rms)
10V 0.068 0.05 0.06
1.018V 0.1 NA 0.03
Output Current and Limits
Output Voltage Output Current Limit Output Impedance
10V 12 mA (Note) ≤ 1 mΩ
1.018V 20 pA ≤ 1 kΩ
Note: Limit output current to ≤ 0.1 mA to realize 72 hour battery operation.
www.valuetronics.com