Running Individual Tests
The HDTDR Test
4
4-13
5
6
3
2
1
7
8
4
oy21c.eps
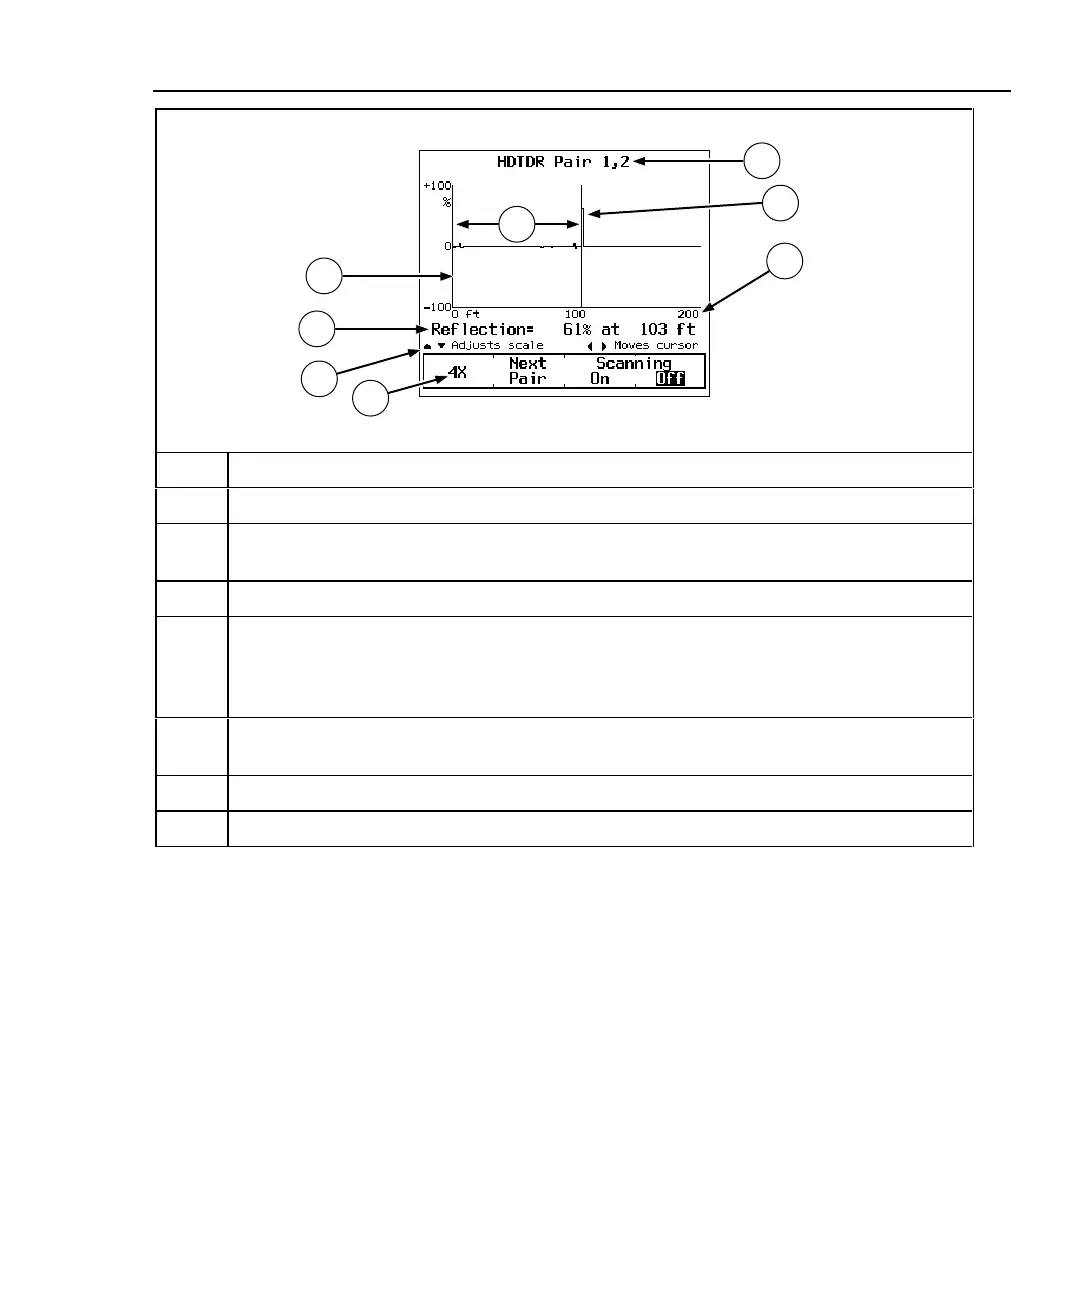
1 The cable pair relevant to the results.
2 The peak value as reported on the results screen.
3 The distance along the cable under test. The 0 at the left of the scale represents the
location of the main test tool.
4 The distance to the end of the cable as reported on the results screen.
5 The percentage of reflected signal relative to the size of the HDTDR test signal. Positive
values indicate locations on the cable where the impedance is higher than the cable’s
characteristic impedance. Negative values indicate locations on the cable where the
impedance is lower than the cable’s characteristic impedance.
6 The Cursor Readout shows the location and the reflection percentage at the cursor’s
position. Use L R to move the cursor left or right.
7 Use D U to change the maximum distance of the horizontal scale.
8 Toggles the vertical scale from 100% (1X) to 25% (4X).
Figure 4-3. Example of an HDTDR Plot (Twisted Pair Results)
 Loading...