Product description
1.12 QS4 Technical Reference Manual
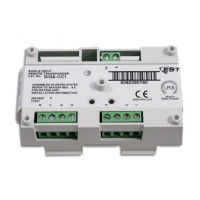
Interpretation of screen displays
HH:MM:SS MM/DD
System
Normal
Project Name
Alarm History:
nnnn
This is what the panel display looks like when there are no event
records posted in a display queue.
HH:MM:SS is the current time in hours, minutes, and seconds
MM/DD is the current month and date
nnnn is the number times the panel went into alarm since being
placed into service
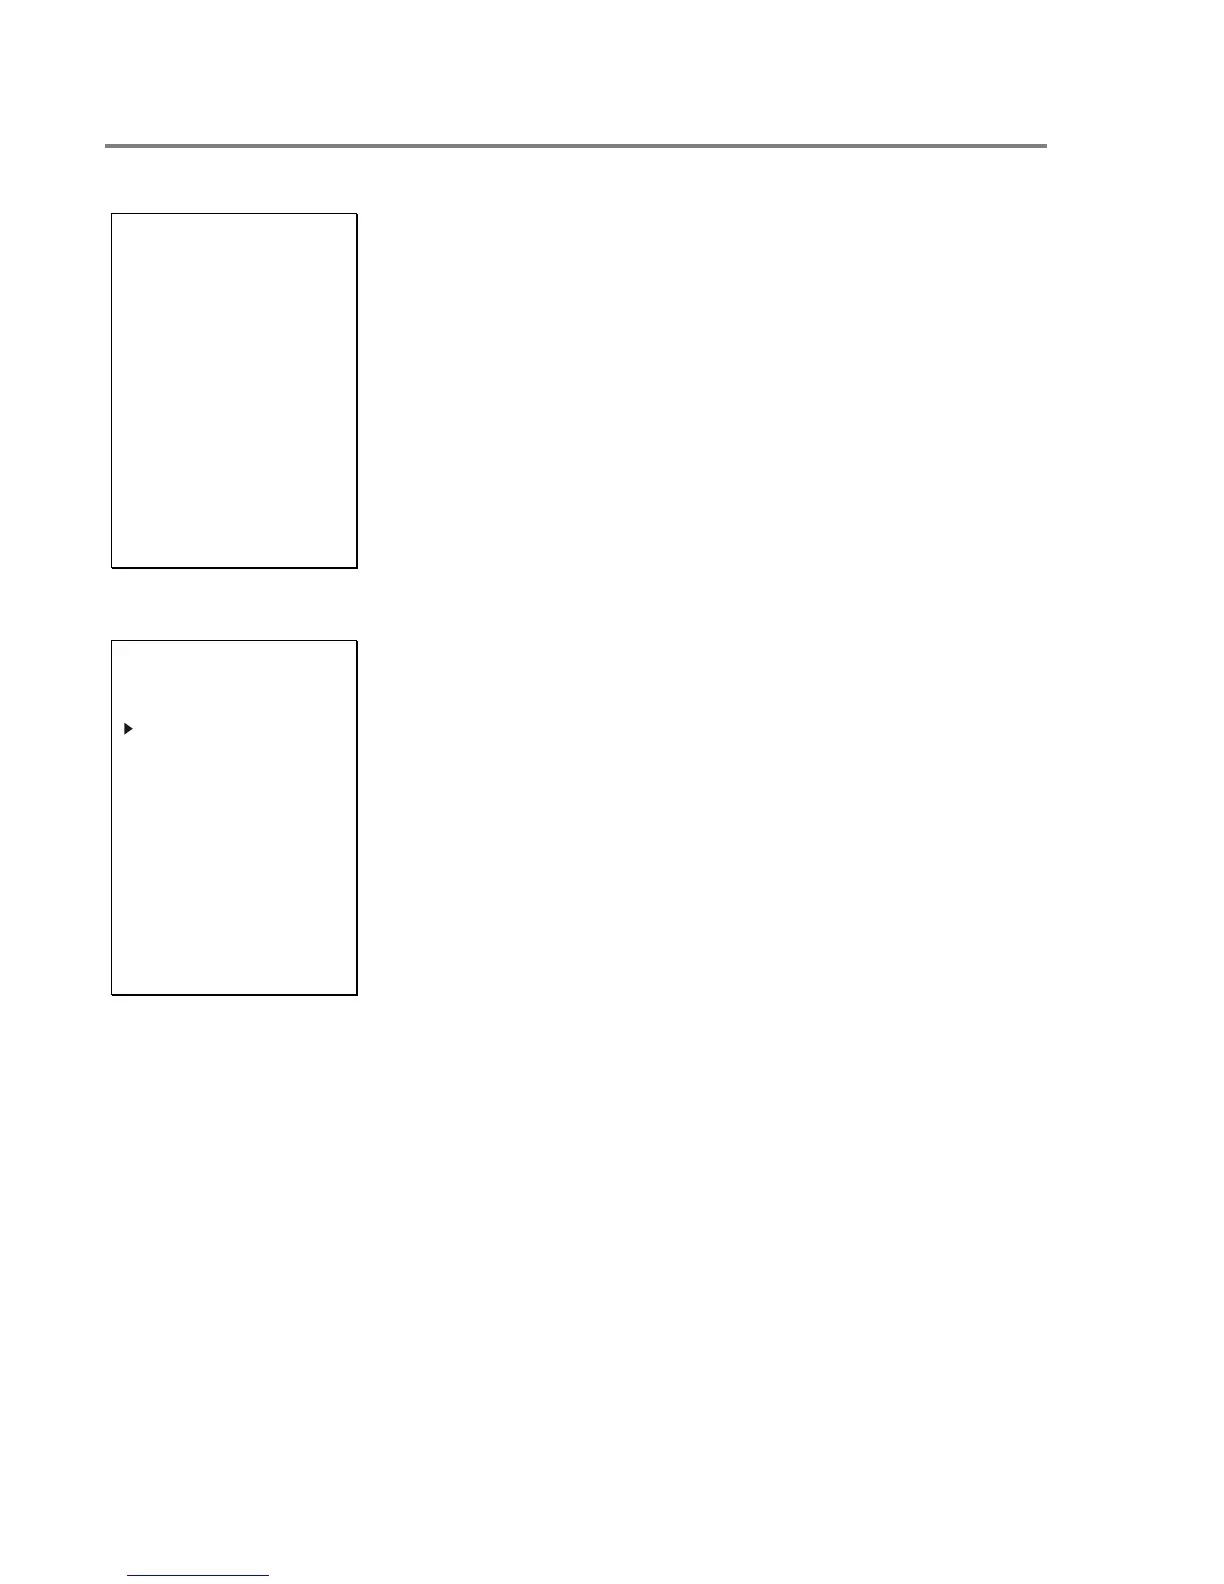
HH:MM:SS
Axxx Dxxx
nnn event name
Custom message 1
Custom message 2
nnn event name
Custom message 1
Custom message 2
ALM SUP TRBL MON
aaa sss ttt mmm
This is what the panel display looks like when there are event
records posted in a display queue.
HH:MM:SS is the current time in hours, minutes, and seconds
Axxx is the current number of active points
Dxxx is the current number of disabled points
These items comprise the event record:
nnn is the posting sequence number (001 = first, 002 = second, and
so on)
event name is the event produced when the device changed states.
Refer to Table 1-1.
P:pp C:cc D:ddd is the address of the device that signaled the
event (P = panel number, C = card number, D = device number)
The event record may also include a custom message that typically
indicates the location of the device, depending on the panel
programming.
These items indicate the content of the display queues:
aaa is the number of alarm event records (highest priority)
sss is the number of supervisory event records
ttt is the number of trouble event records
mmm is the number of monitor event records (lowest priority)
Technical Manuals Online! - http://www.tech-man.com