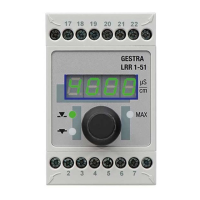
55LRR 1-52, LRR 1-53, URB 55 - USA - Installation & Operating Manual - 850703-00
Configuring the conductivity controller
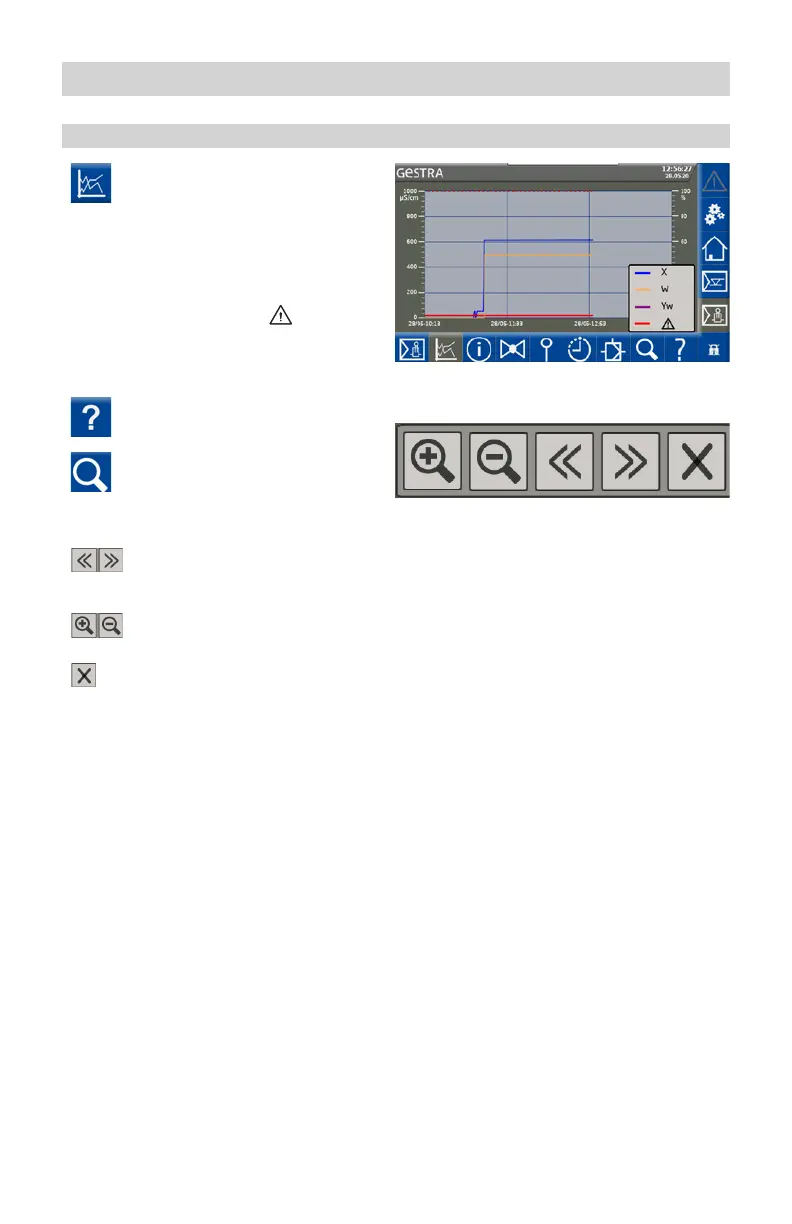
Trend log
Open the trend log.
Description of display
The trend log shows the characteristic curve of
the actual value (X), set point (W), manipulated
variable (Yw) and alarm limits (
) over a 7-day
period. The sampling rate is 5 seconds.
Options:
Open the associated key.
Open a menu bar with further
functions:
Navigation:
Navigate forwards and backwards
on the time axis using these but-
tons or by swiping horizontally
Zoom in/out using these buttons or
two fingers (pinch gesture)
Close the window
 Loading...