3.5 X-Y Function application
The phase change of the measured signal is displayed as XY after the signal passes
through a certain electric network, and the following steps are carried out:
1. Press [CH1] to set the probe option as 10×.
2. Press [CH2] to set the probe option attenuation as 10×.
3. Set the switches on both probes as ×10.
4. Connect the probe of channel 1 to an input point of the network, and connect the
probe of channel 2 to an output point of the network.
5. Press [AUTO].
6. Revolve [Volt/div] to make that the signal amplitudes displayed on the two channels
are roughly the same.
7. Press [DISPLAY], and select “XY” in a format option.
A Lissajous pattern is displayed on the screen to represent input and output
characteristics of the circuit.
8. Revolve [Volt/div] and the vertical [POSITION] so as to optimize the display.
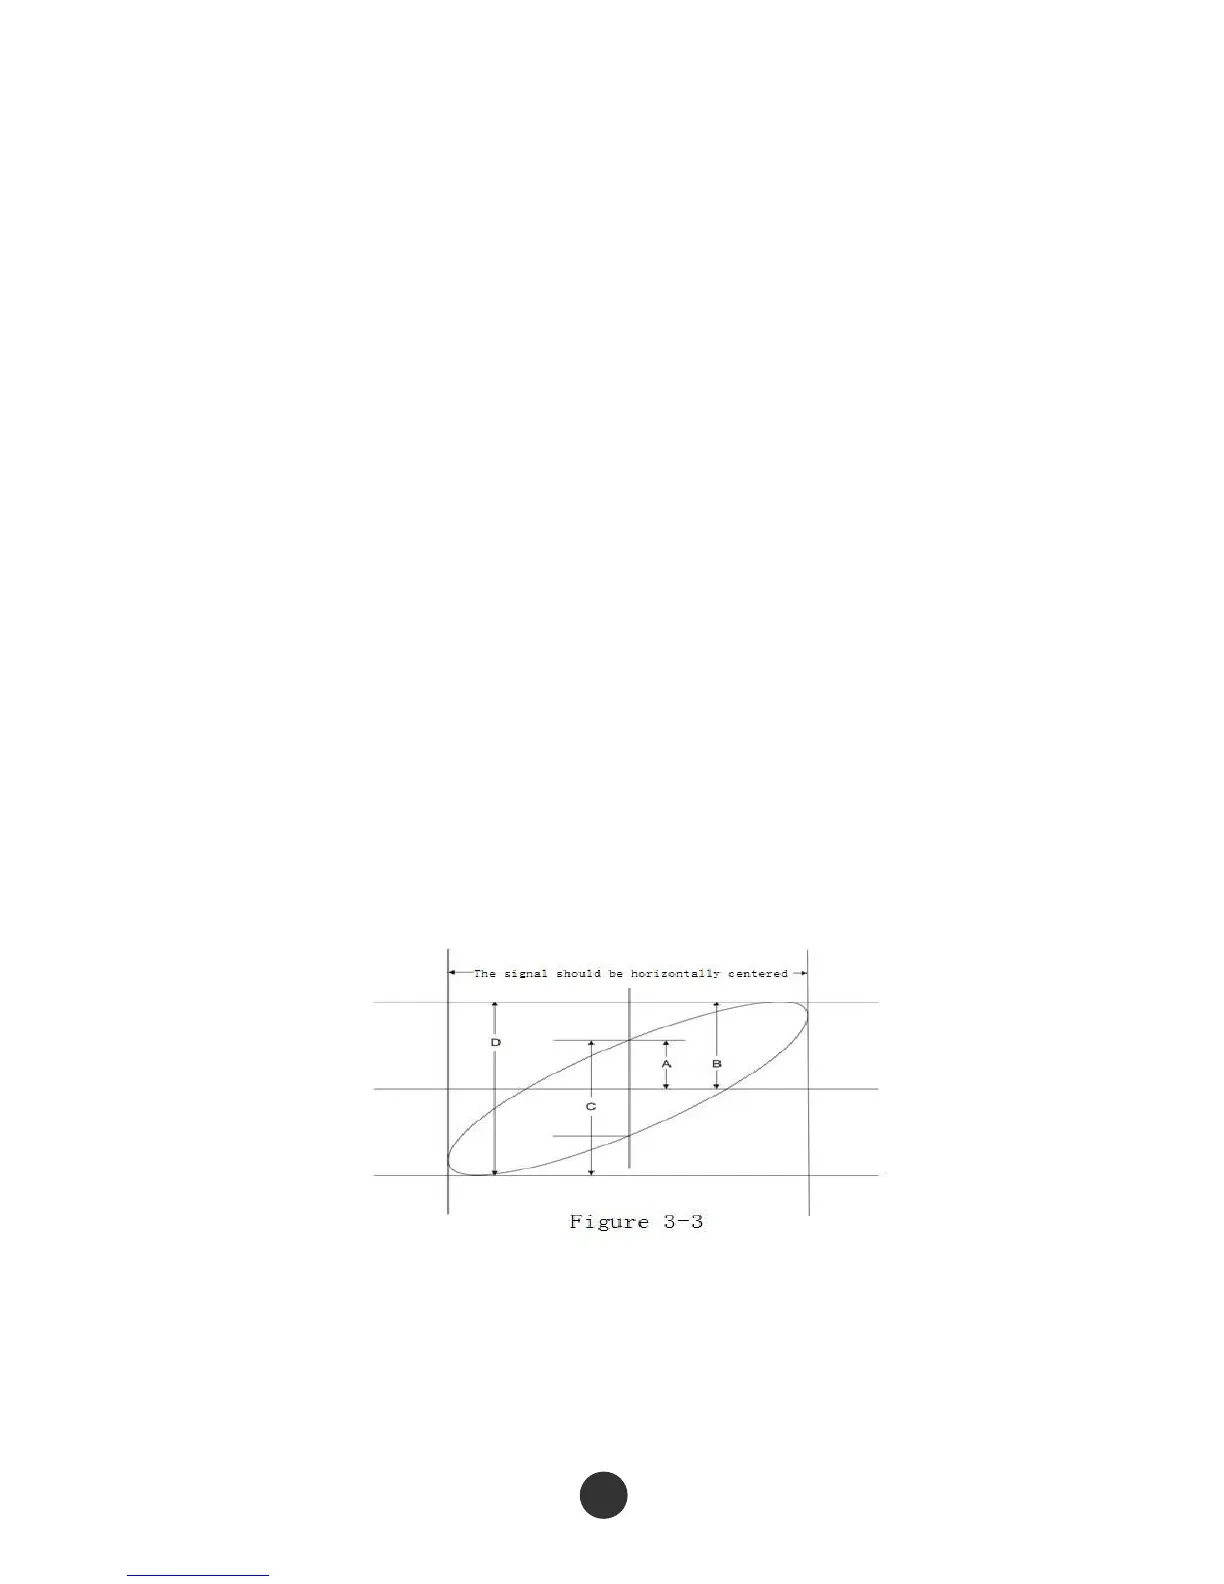
9. Observe and calculate the phase difference by an elliptical oscillography graphical
method. (Shown in the figure below)
The phase difference angle theta is equal to +/- arcsin (A/B) or theta is equal to +/-
arcsin (C/D) according to the formula sin theta=A/B or C/D, wherein theta represents
the phase difference angle between the channels, and A, B, C and D are defined in the
figure above.
88