4. Tap Save to confirm and save the calibration data.
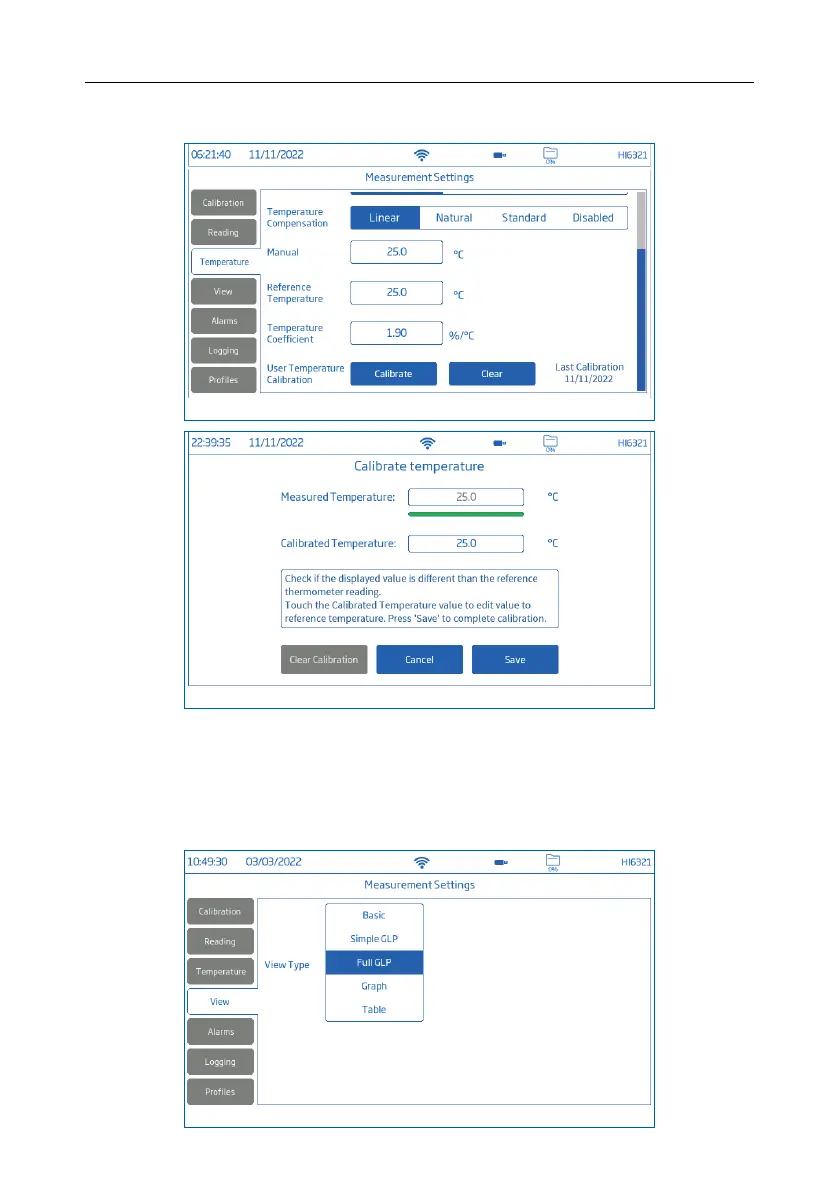
9.4. VIEW
Conductivity, Salinity %: Basic, Simple GLP, Full GLP, Graph, Table
Resistivity, TDS, Salinity ppt & PSU: Basic, Simple GLP, Graph, Table
• Select preferred display configuration from View Type window.
Measurement & Probe Setup Menu 42