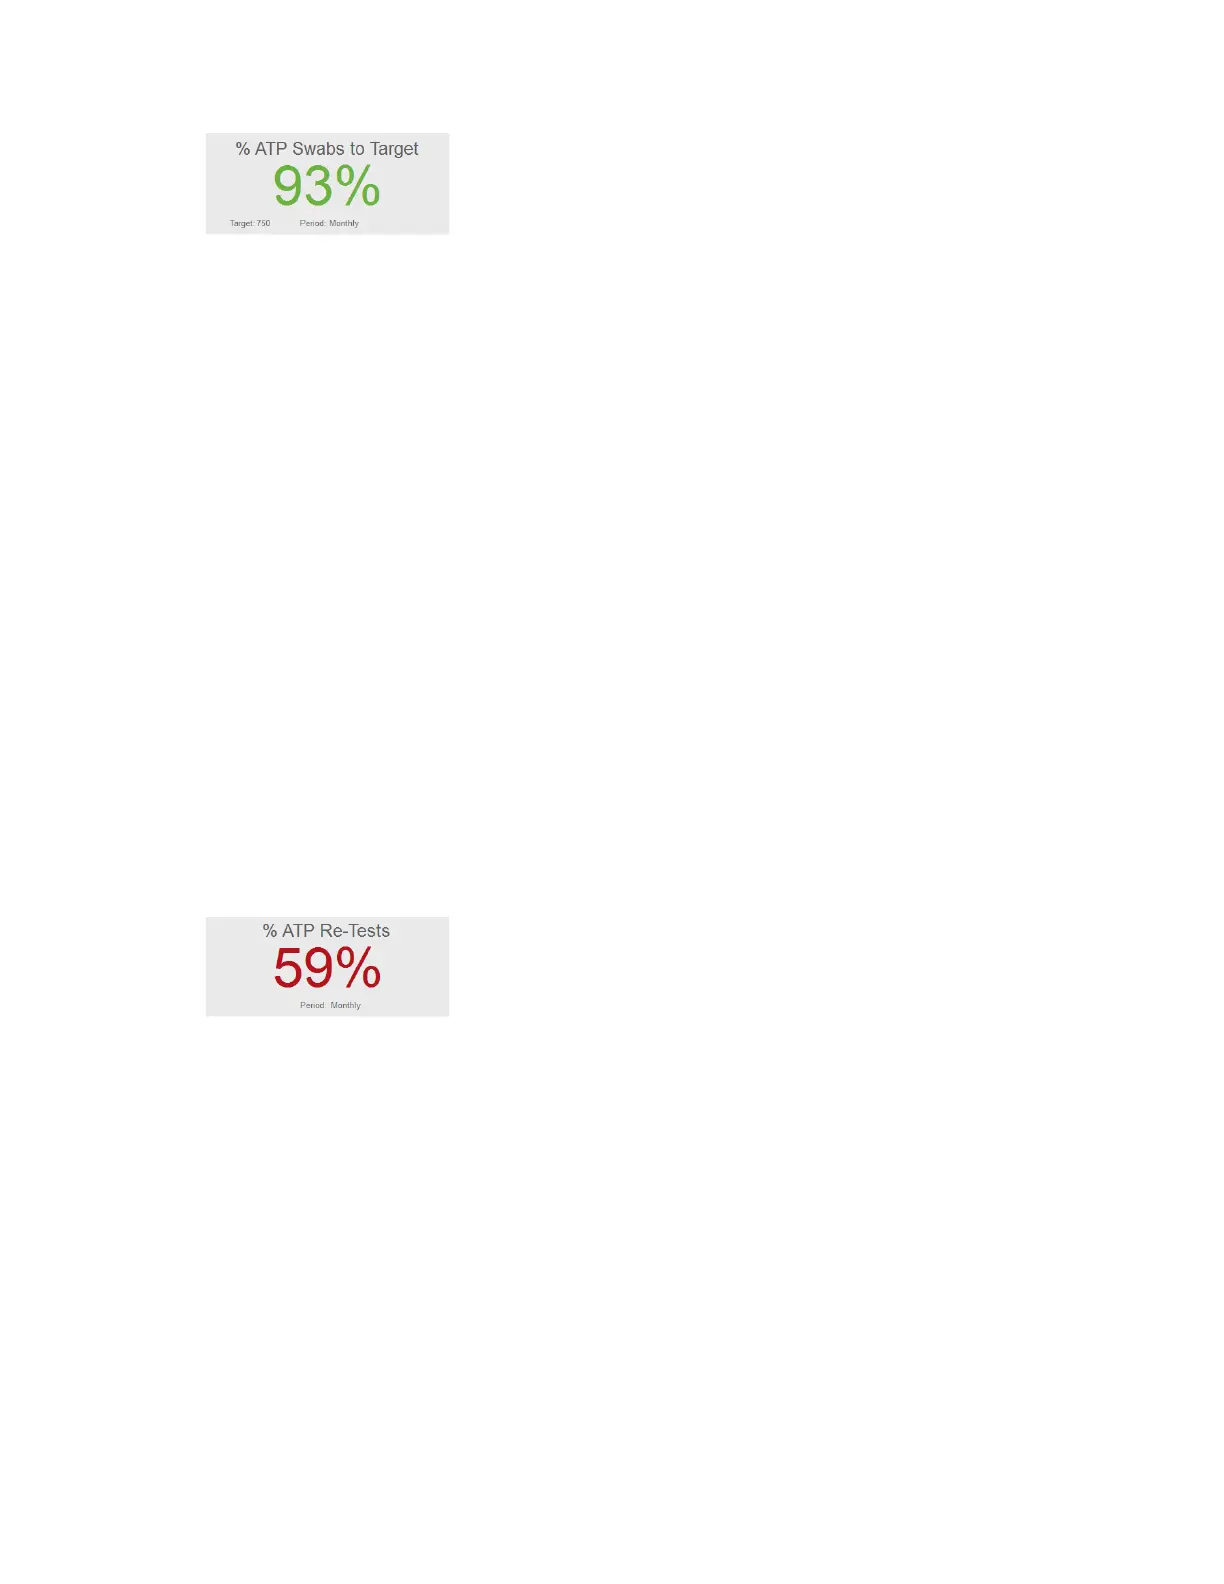
ATP Swabs to Target Widget
Allows users to set a target for the number of ATP swabs used and measure active usage against
this target. This data provides a quick assessment if the correct amount of swabs are being used,
indicating sufficient testing is taking place, or if testing needs to increase to ensure the plan is on
track.
The reading is based on the total amount of ATP test results uploaded to the ICON software
compared to the defined target quality goal for a given period.
• For example, if the target number of swabs is 200 per month and the ICON software
contains 50 test results for that time period, the ATP Swabs to Target percentage is 25%.
• Quick-test results are not included in the total ATP test results unless they are
subsequently saved and converted.
Setting ATP Swab Target
• Select the dropdown arrow at the top corner of the “% ATP Swabs to Target” widget.
• Select target frequency (Weekly, Monthly, Quarterly, Annually).
• Enter the target number of swabs based on the time period (ex. 300 per month, 75 per
week, etc.).
• Select “OK”.
When the target and frequency are indicated, the percentage of swabs used will automatically
update based on the total amount of results uploaded to the software.
ATP Re-Tests Widget
Defines how many test points have been coded as a re-test over a period of time. Re-tests are
commonly performed if a test point has produced a warn and/or fail result, therefore, the higher
the percentage of re-tests, the more often a test point has been re-cleaned and re-tested. Results
can be viewed Weekly, Monthly, Quarterly, or Annually.
Setting ATP Re-Test Target
• Select the dropdown arrow at the top corner of the “% ATP Re-Test” widget.
• Select the desired frequency (Weekly, Monthly, Quarterly, Annually).
• Check “Warnings Included” if your program requires all “warn” results to be re-cleaned
and re-tested.
• Select “OK”.
Note: It is critical before testing with the MVP ICON to determine if only failed results will be re-
tested or if results with both a fail and warn reading will be re-tested, per your standard
operating procedures. This impacts how the re-test data is displayed in the graph.
27
 Loading...