Pass/Warn/Fail Computed Data
There are four different options of computed data for this report.
• % P/W/F – Calculates data by percentage of passed, warned, and failed test points; sort
by test point or by period, graph view defaults to test point number in numerical order
• % P/W/F (Grouped) – Groups all pass, warn, and fail results for a specified period of
time; sorting by test point/period not an option
• # P/W/F – Calculates data by number of passed, warned, and failed test points; sort by
test point or by period, graph view defaults to test point number in numerical order
• # P/W/F (Grouped) – Groups all pass, warn, and fail results for a specified period of time;
sorting by test point/period not an option
Average Test Point Summary
This report shows the average result for selected test points over a specified period of time. By
looking at the average result for each test point, the user is given a quick overview of test point
behavior to determine where, if any, problems reside. There are three types of charting options
for this report:
Available chart types
• Column
• Line
• Min/Max/Avg
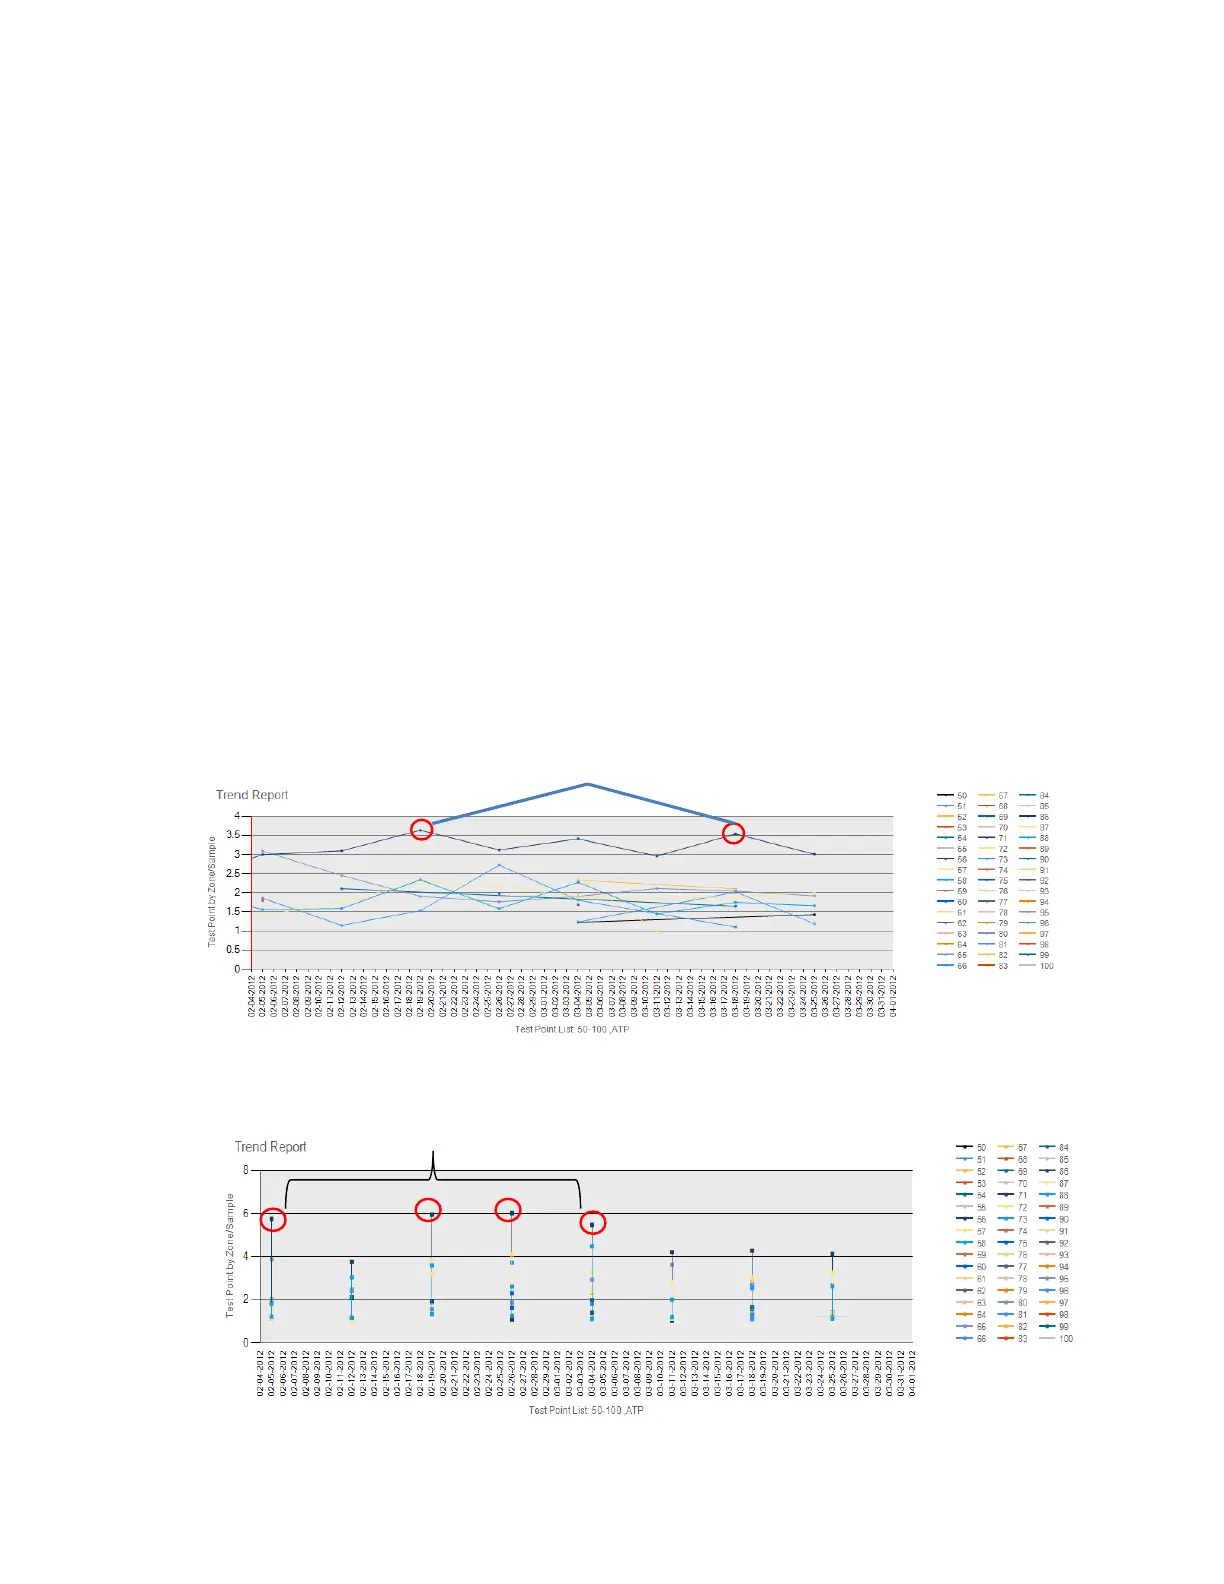
Line Chart – Sorted by Test Point
Min/Max/Avg Chart – Sorted by Test Point
Max results show outliers
48
 Loading...