Analyzing MVP Collection Data
As mentioned in Chapter 17, test point results from multiple parameters can be combined to
view data as an inter-related set. This helps to identify any potential trends that exist between
the individual parameters. Please
see Chapter
17 for setting up MVP Collection.
H
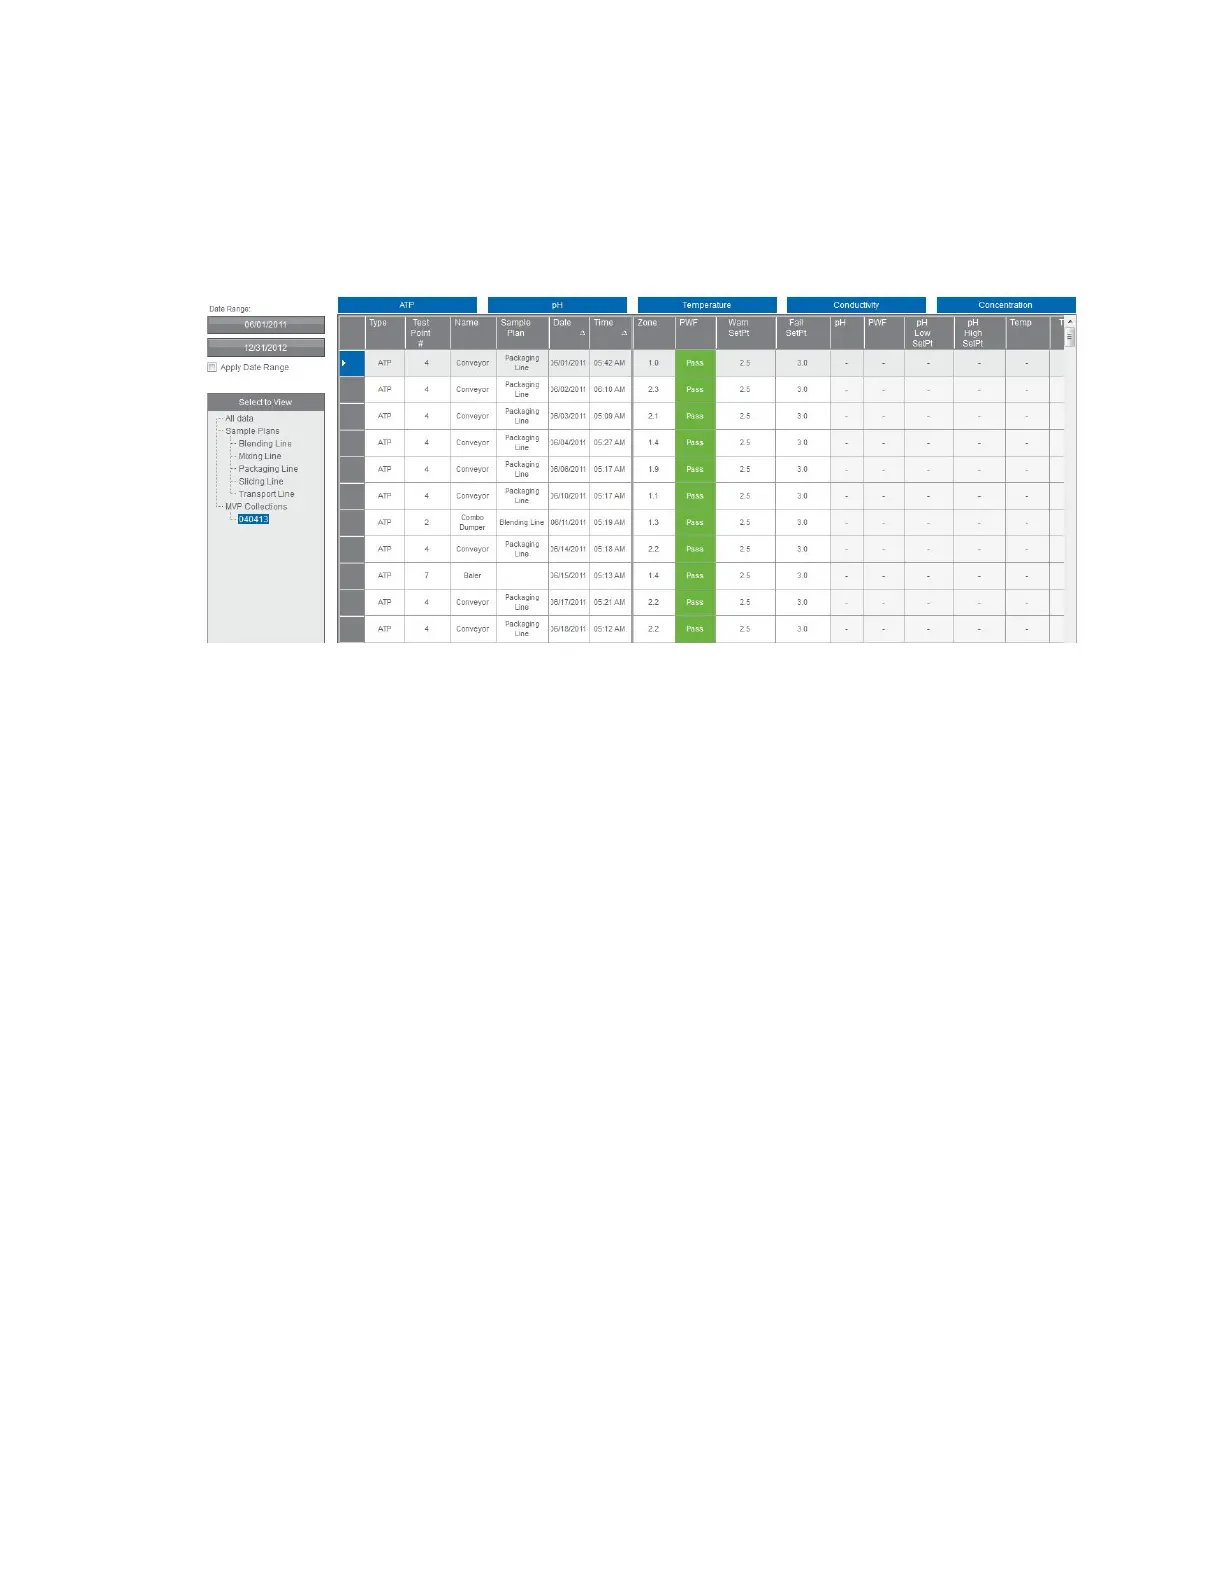
ow to Analyze Data MVP Collections in Raw Data
• Click on the desired MVP collection under the “Select to View” section to the far left of
the screen.
• Columns are first sorted by test point number, then by date to group all related
parameters for a particular test point together. Data for each parameter is sorted in the
appropriate column.
• Each column can be sorted by the desired column order; either ascending or descending.
• The first six columns in MVP Collections will be frozen to allow users to view other
parameters for data analysis.
Printing MVP Collections
Due to the size and format of MVP Collection data, it cannot be printed as a PDF file from the
software. Instead, copy and paste all data into an Excel file by highlighting the data and pressing
“Ctrl + C” from your keyboard, then pasting into an Excel file.
60
 Loading...