Test Point Trend Computed Data
There is one option of computed data for this report.
• Results – Plots each test point result (as scatter plot) over a period of time; sorting
defaults by test point number in ascending order; Grouped Data not an option
Note: To view results by hour select “Hour” under Date Type.
Re-Test Trend
This report provides a historical view of test points that have been re-tested after having
previously failed over a period of time. Ideally, a test point will have been re-cleaned and re-
tested every time it has produced a warn or fail result. By sorting the data by percentage or
number of re-tests in ascending order, the chart will highlight which test point was re-tested the
least amount of times.
This information helps direct action; improving the cleaning process and the program’s health
over a period of time.
Note: It is critical before testing with the MVP ICON to determine if only failed results will be re-
tested or if results with both a fail and warn reading will be re-tested, per your standard
operating procedures. This impacts how the re-test data is displayed in the graph.
Available chart types
• Column
• Line
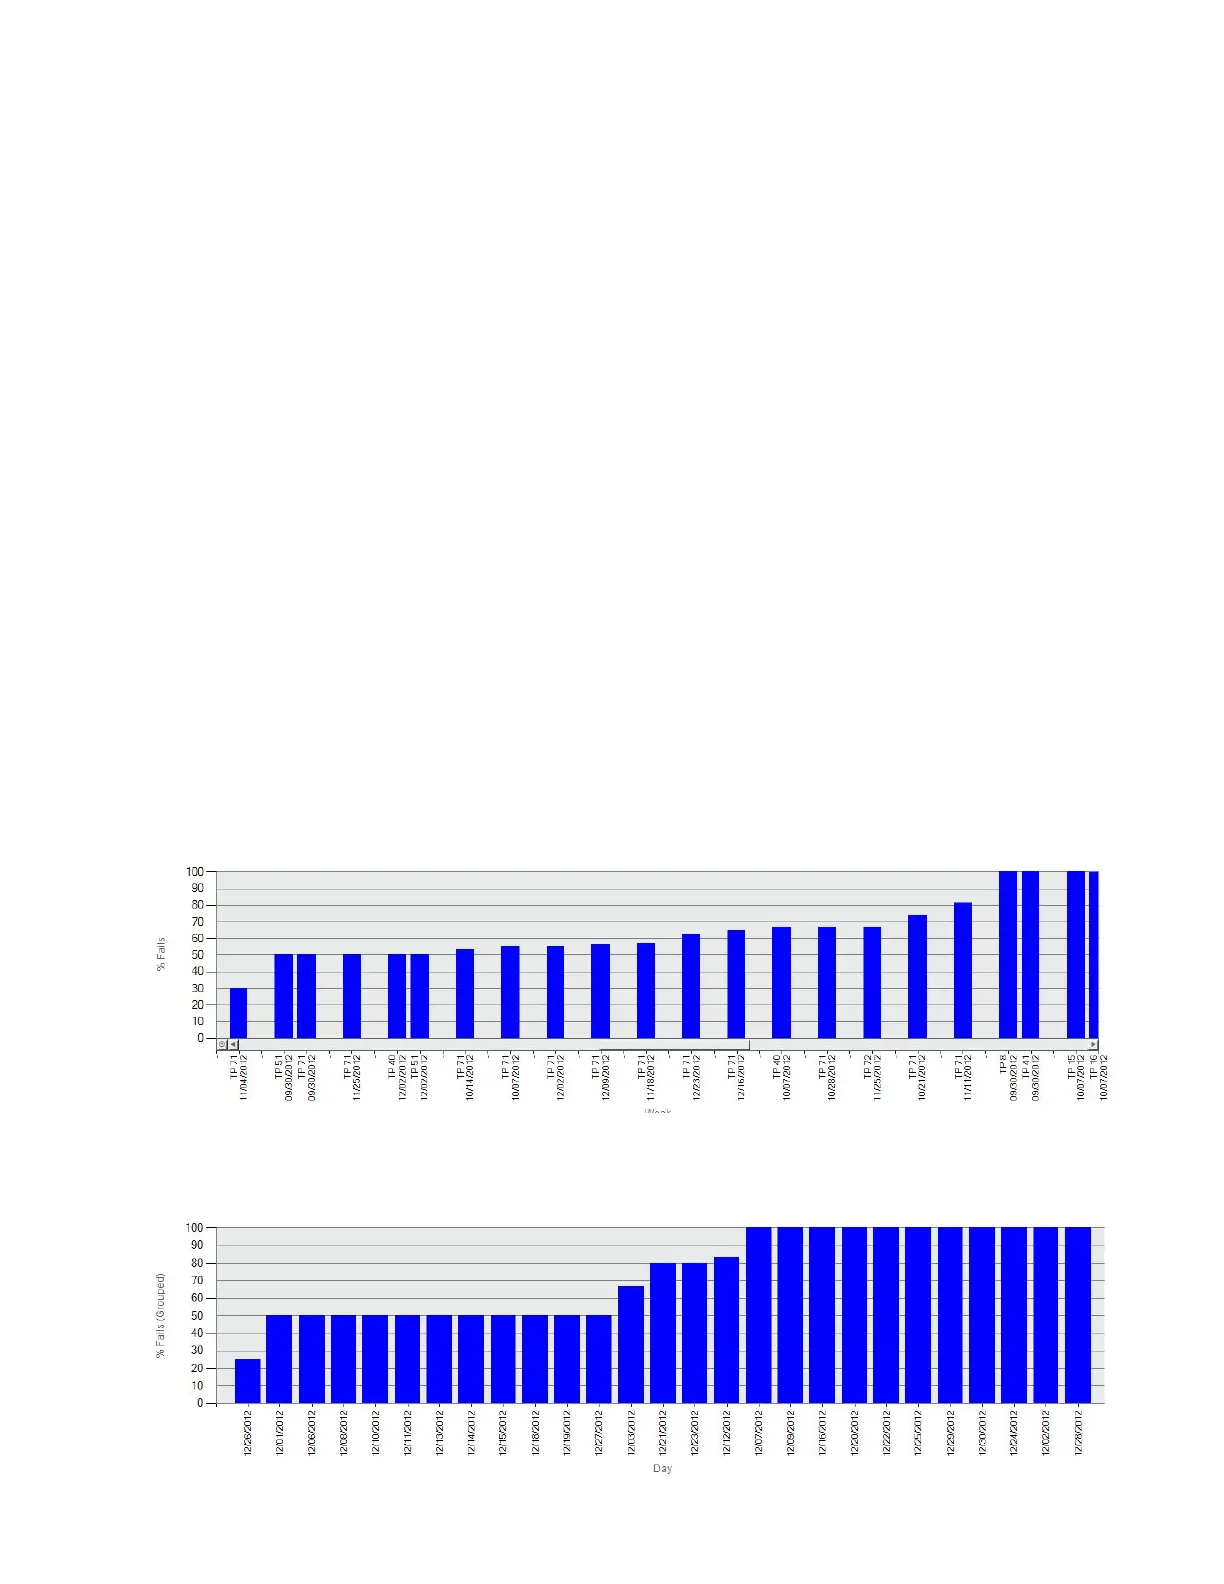
% Fails by Test Point
Sorted by % Fails in
ascending order
Re-Test Trend Column
% Fails (Grouped)
Sorted by % Fails (Grouped) in
ascending order
Re-Test Trend Column
% Fails
51
 Loading...