Test Point Frequency Computed Data
There are two different options of computed data for this report.
• Test Point Overview – Includes the following information for each test point: number of
times tested, number times failed, number times re-tested, and the re-test percentage.
Graph displays as double-axis to incorporate # and %
• # Tests + Re-Tests – Plots the total number of times test point was sampled during a
given period; includes # of re-tests for each test point
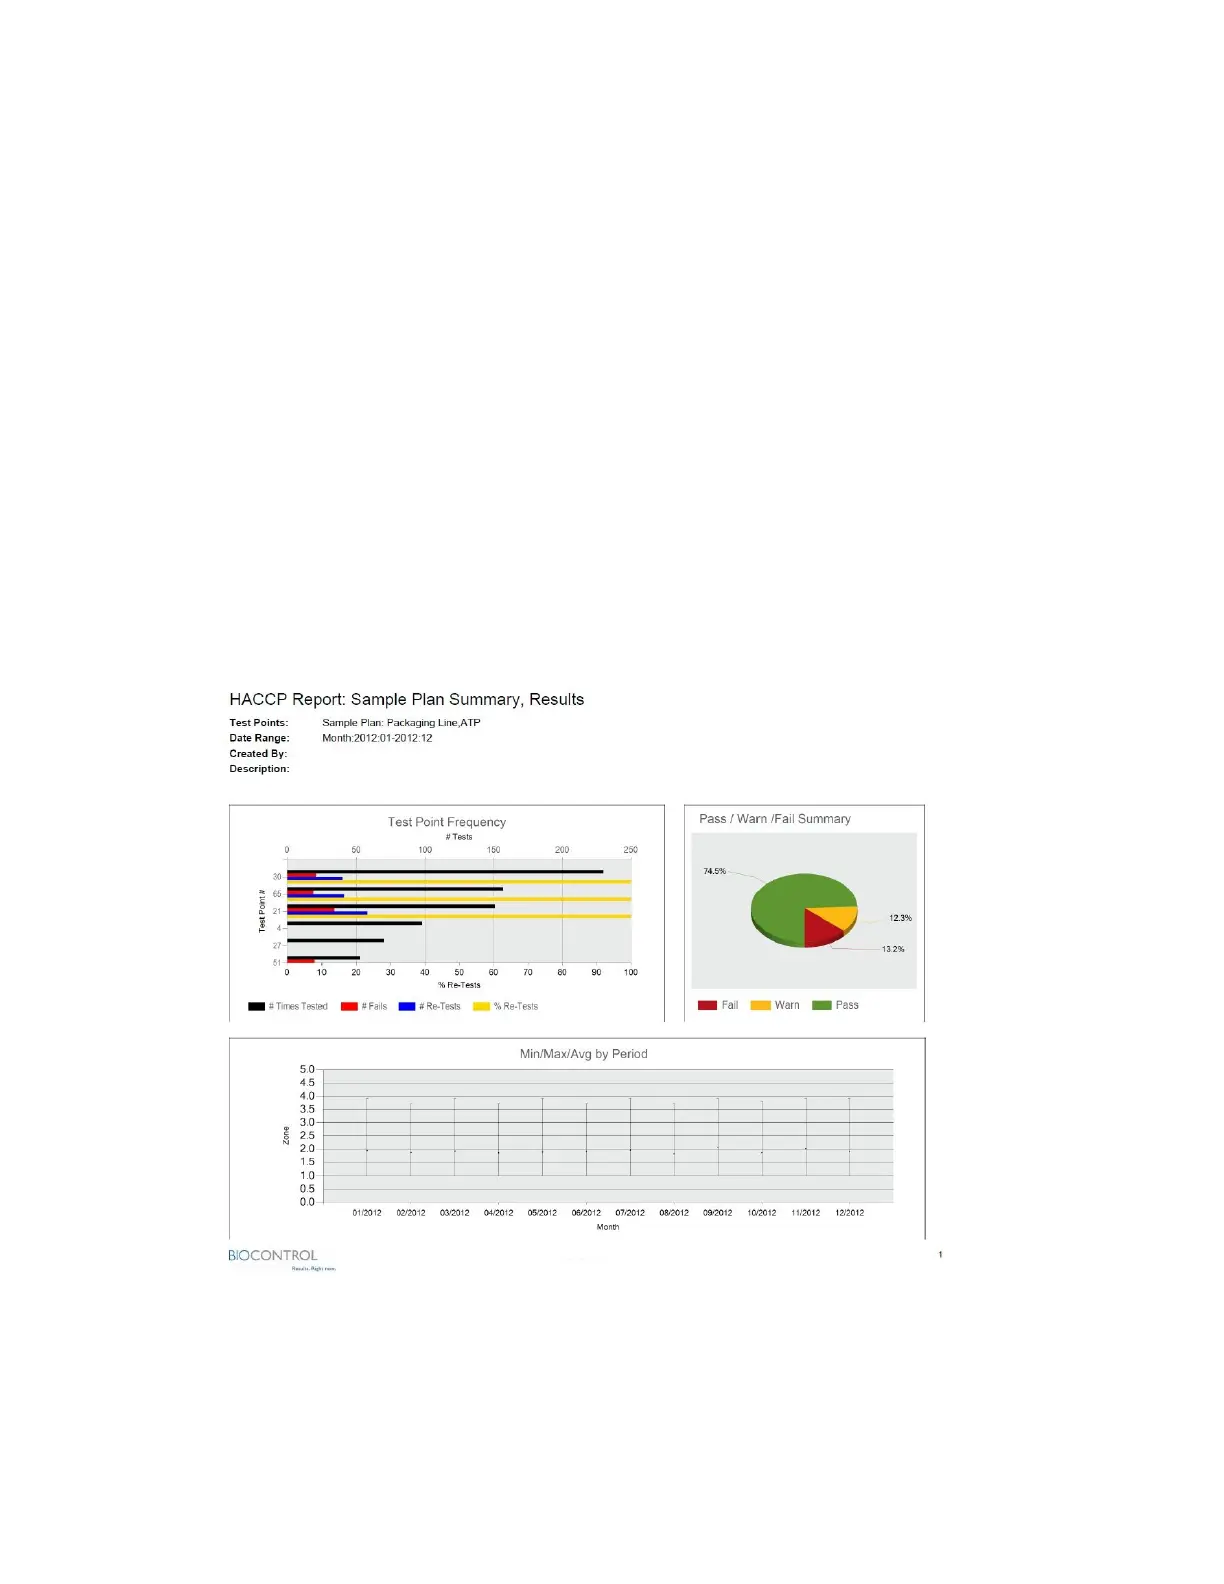
Sample Plan Summary
A collective summary of essential reports for an individual sample plan included on one page;
contains Action, Trending, and HACCP reports. This report allows busy QA Managers to provide a
comprehensive overview for a particular sample plan with a click of a button, eliminating manual
report generation.
Included Reports
• Test Point Frequency (HACCP)
• Pass/Warn/Fail (Action)
• Min/Max/Avg by Period (Trending)
Sample Plan Summary Computed Data
There is one type of computed data for this report.
• Results – Includes reports for Pass/Warn/Fail (pie chart), Average Test Point Summary
(Min/Max/Average Grouped), and Test Point Frequency (Test Point Overview)
Example of Sample Plan Summary
56
 Loading...