Eclipse Additional Information Page 93
The waveform session is now exported for analysis in excel. Please locate the *.xml file, saved under C:\Pro-
gram Files (x86)\Interacoustics\Eclipse\EPxx\Application Data\Exported Waveforms.
For the analysis comparison, the above maximum amplitude of wave I is 82.51µV at peak.
To check this in the analysis software (excel), the data must be scaled into µV.
The Analog to Digital converter has a resolution of 16 bit, which in turn means, it can represent an amplitude
with a number from ± 32768.
The Analog to Digital converter can maximum handle a signal of ±1.6V from the preamplifier.
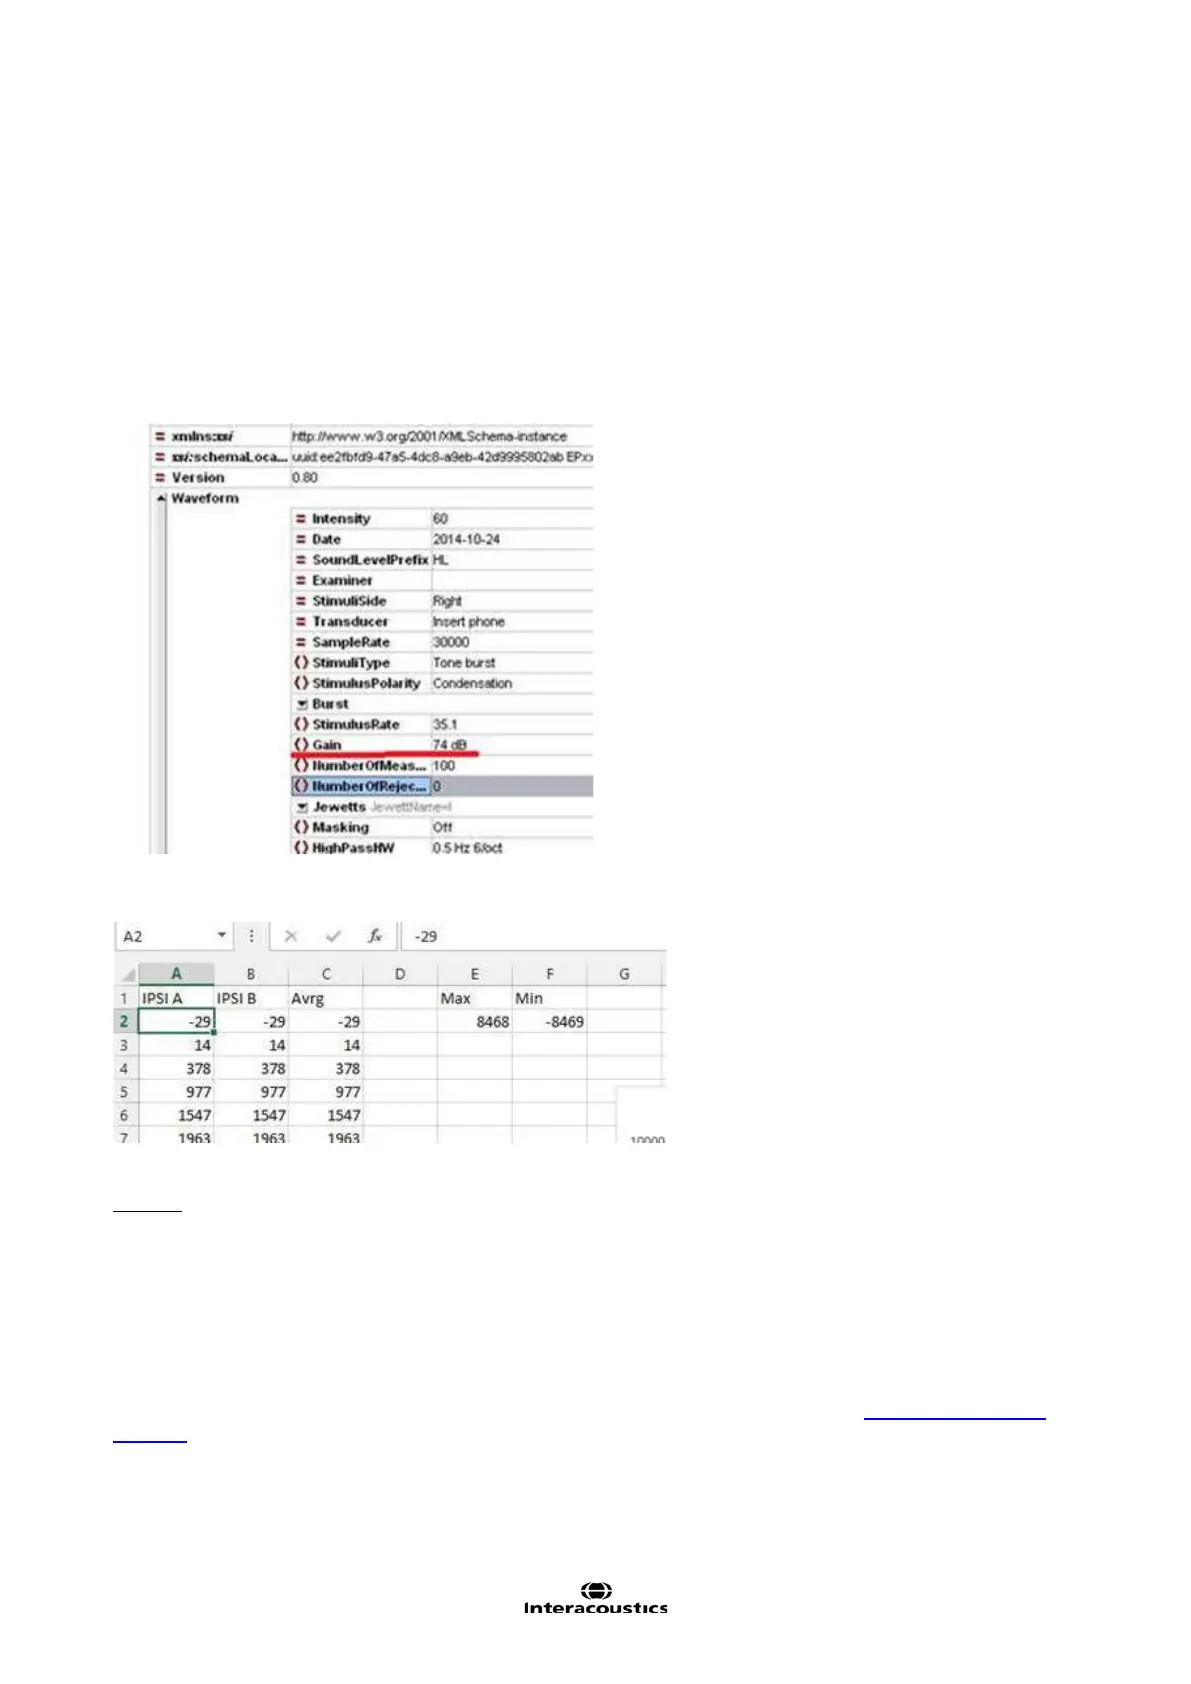
The Eclipse gain in this exported waveform session is set to 74dB.
This means that the data in the buffer has a resolution of (1.6V/74dB)/32768 = 9.7425nV.
The gain and the other parameters can be found in the exported xml file, below displayed in explorer.
Opening the exported waveform in Excel, the below numbers are found as the maximum and minimum am-
plitude.
The maximum amplitude of the averaged curve is the value 8468, which correspond to 8468x9.7425nV =
82,5µV.
This is the same maximum amplitude as seen within the EPx5 software and the basic comparison analysis
shows that data should be the same.
Here some examples in Excel and Matlab.
In Matlab it is easy to show also the frequency contents of the recorded data, e.g. it could be the electrical
stimuli recorded using the loopback test box.
The examples on next page, are the recordings of two loopback tests, using Toneburst 2kHz and CE-Chirp
LS stimuli.
Would you like to have a copy of the research template, feel free to send an email to
service@interacous-
tics.com
The excel template, makes it easier to have all data scaled, and it holds user entries, so it can be altered for
individual measurements.
Matlab is used to show the frequency responses of the stimuli, as this operation is quite easy from Matlab.