-35- v2.9
Data Access
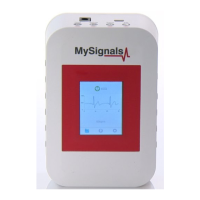
Then you will enter in “Select Sensors” screen where you must select all the sensors that you want to measure.
Selected sensors are in blue color and unselected sensors are in gray color.
Figure: TFT Select Sensor
Once you have completed your selection you must click on “Data” button, which you can nd at the left end of the
bottom toolbar.
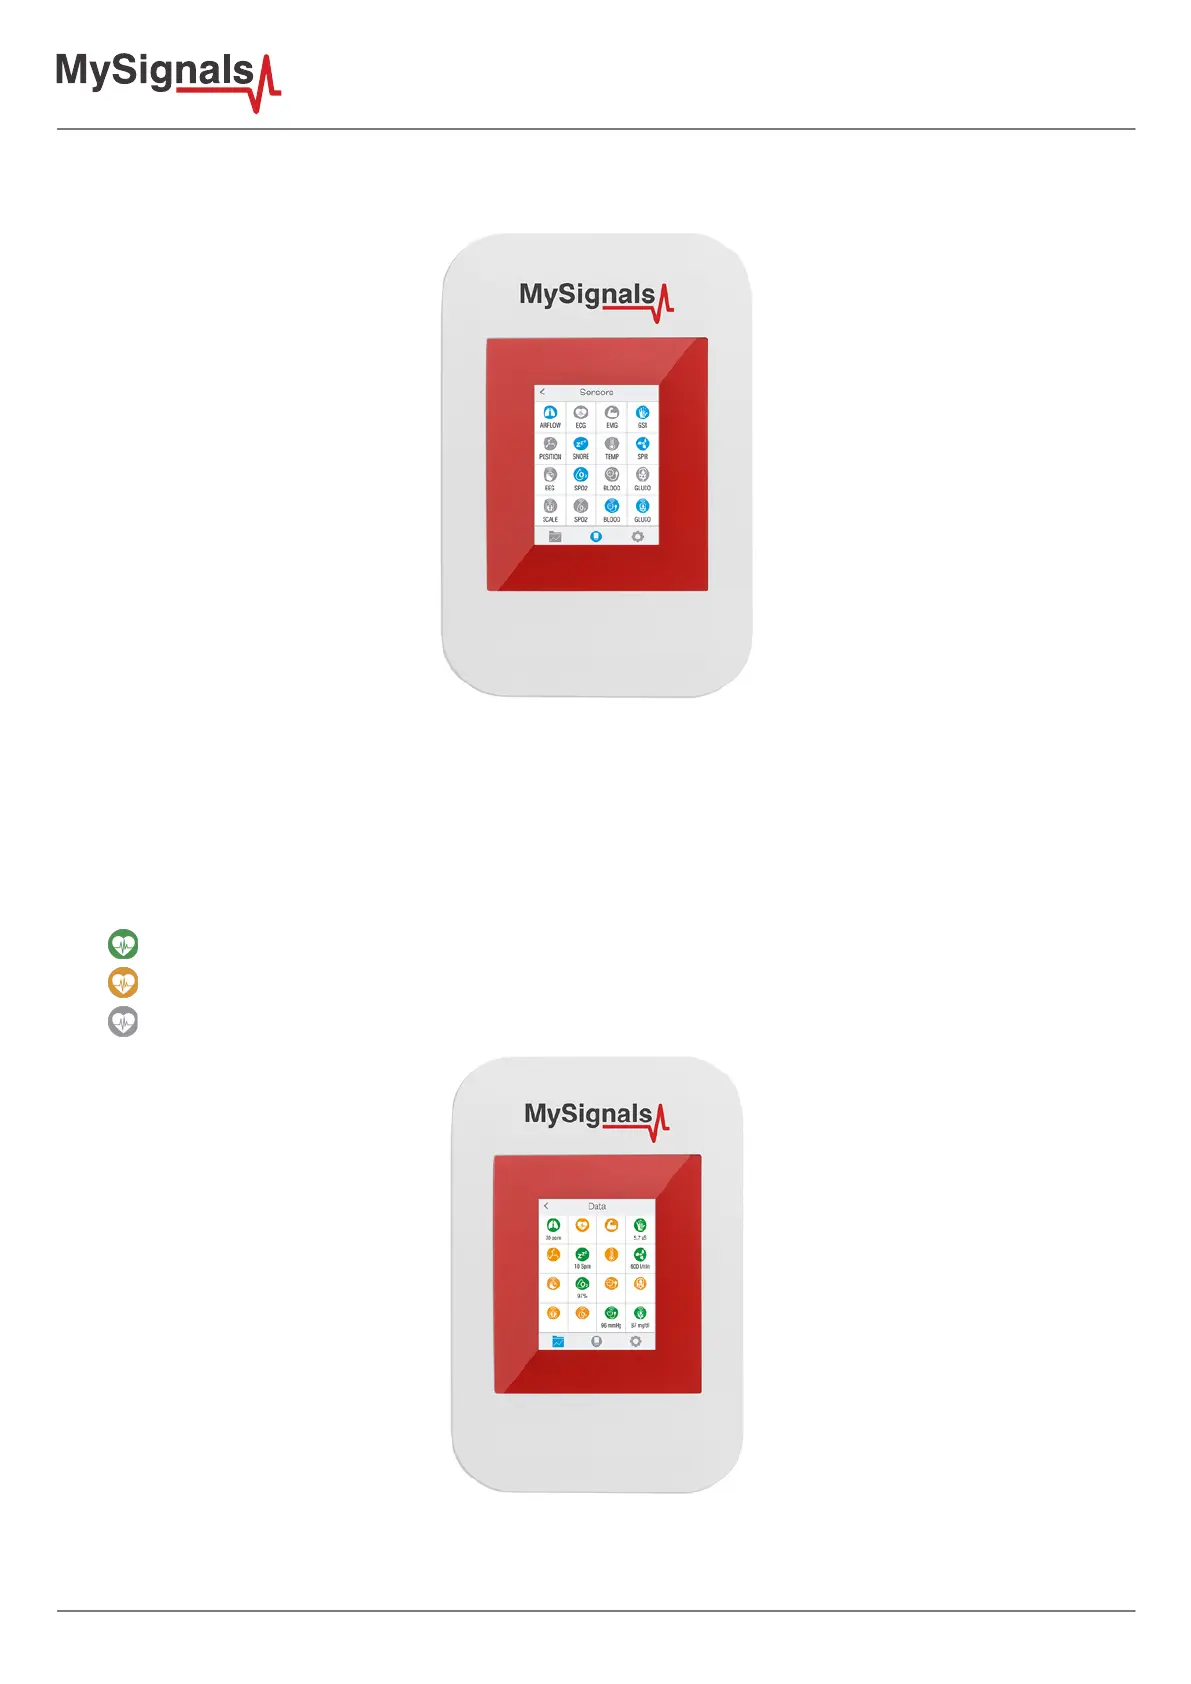
In “Data” screen you will be able to see in one glance the main information of all sensors at once. The selected
sensors will be green and sensors are not selected in orange.
You can see in this screen a color code in the sensor logos:
• Green: It is a real- time value measured in MySignals Software
• Orange: It is an old value measured in a previously connection of some time ago.
• Grey: It is that the sensor is not connected.
Figure: TFT data