-36- v2.9
Data Access
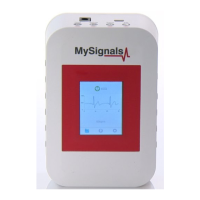
If you are interested in viewing all the information in one particular sensor simply you have to click on it to enter a
detail sensor view. On this screen you can see a graph of one of the sensor values and all the detailed information
on a list view.
Figure: TFT detail view
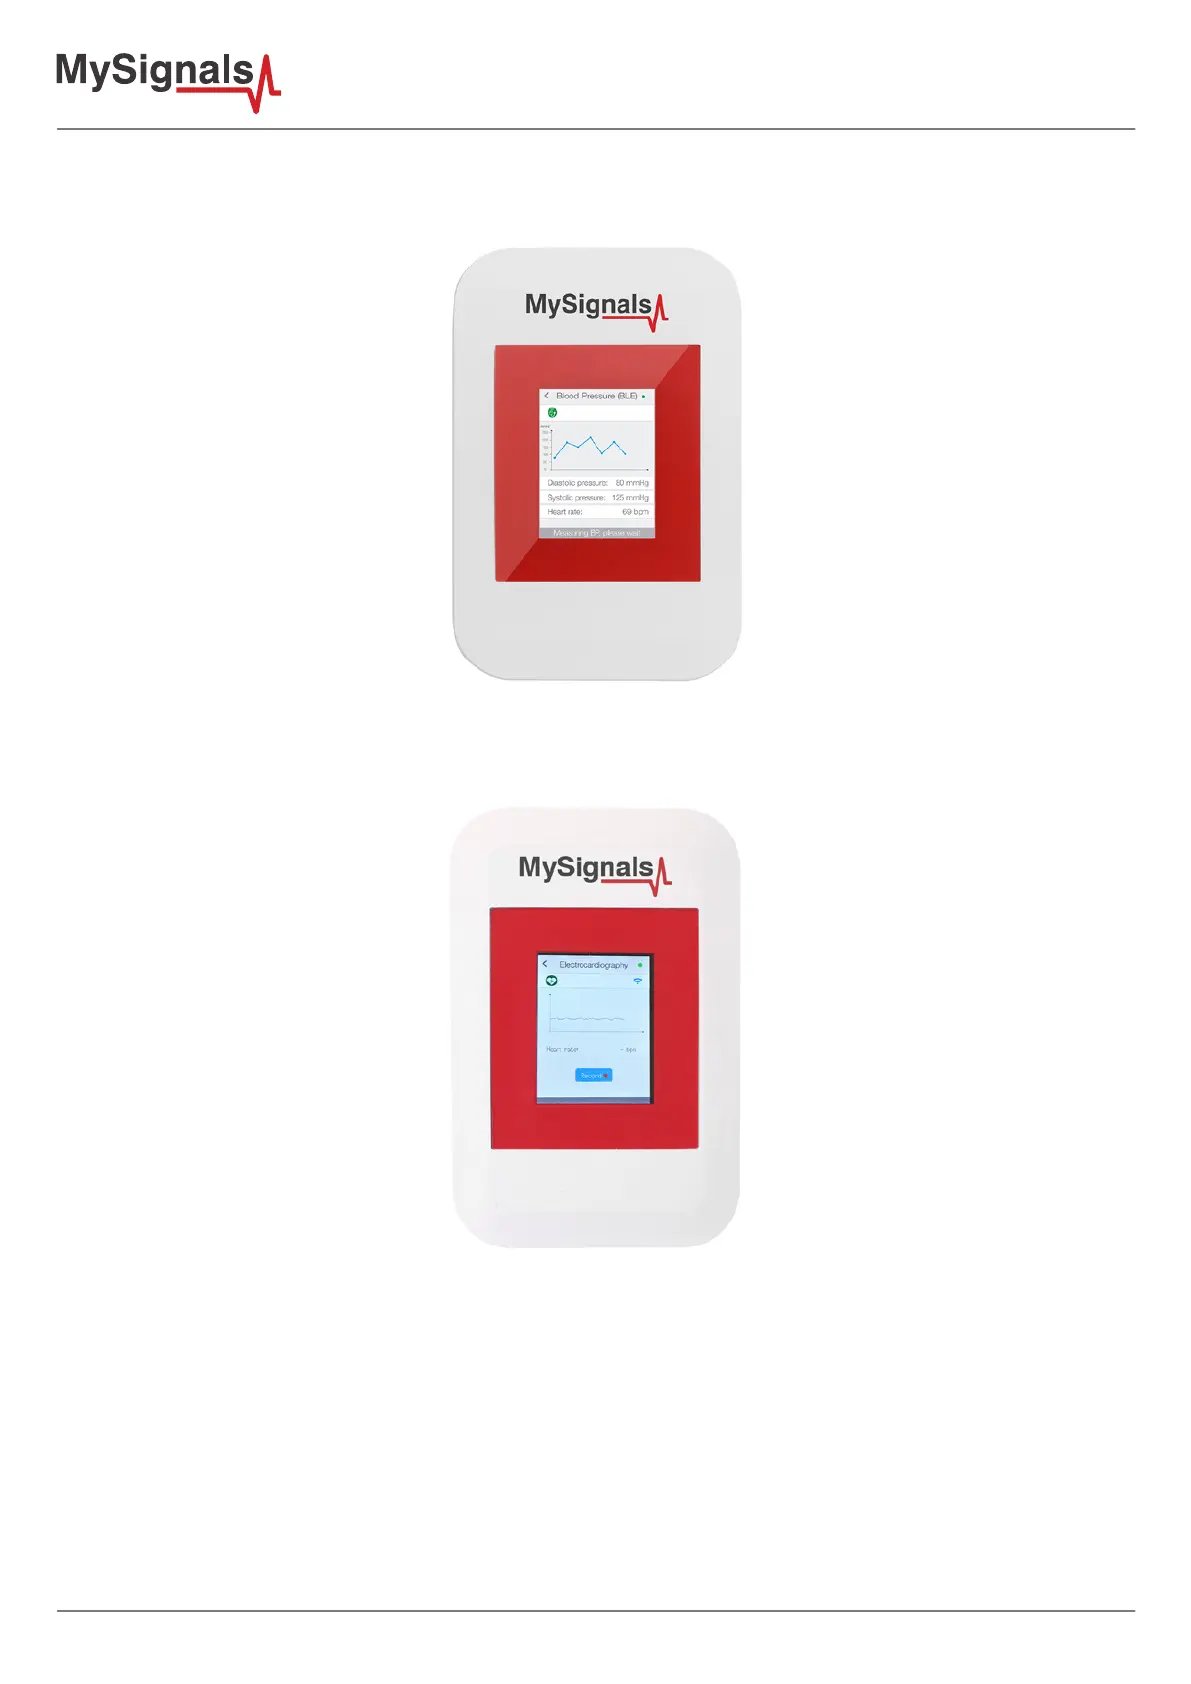
In February 2017 we have released new Firmware, Apps and Cloud versions that allow to record continuous waves and send
them to the Cloud (in Server Mode). You can record up to 30 seconds of the data measured in detail mode of ECG, EMG,
Snore and Airow.