-49- v2.9
Data Access
MySignals device will send data to application using two modes:
• In General mode the MySignals device will send all values for all sensors, this is used for main sensors screen
where we show a list of selected sensors by the user with its values.
You can see in this screen a color code in the sensor logos:
• Green: It is a real- time value measured in MySignals Software
• Orange: It is a old value measured in a previously connection of some time ago.
• Grey: It is that the sensor is not connected.
• Regarding to Detail mode, it is used when the application shows a detailed view from sensor, MySignals will
only send data for this single selected sensor. The application will send a sign to MySignals to switch on and
o this mode.
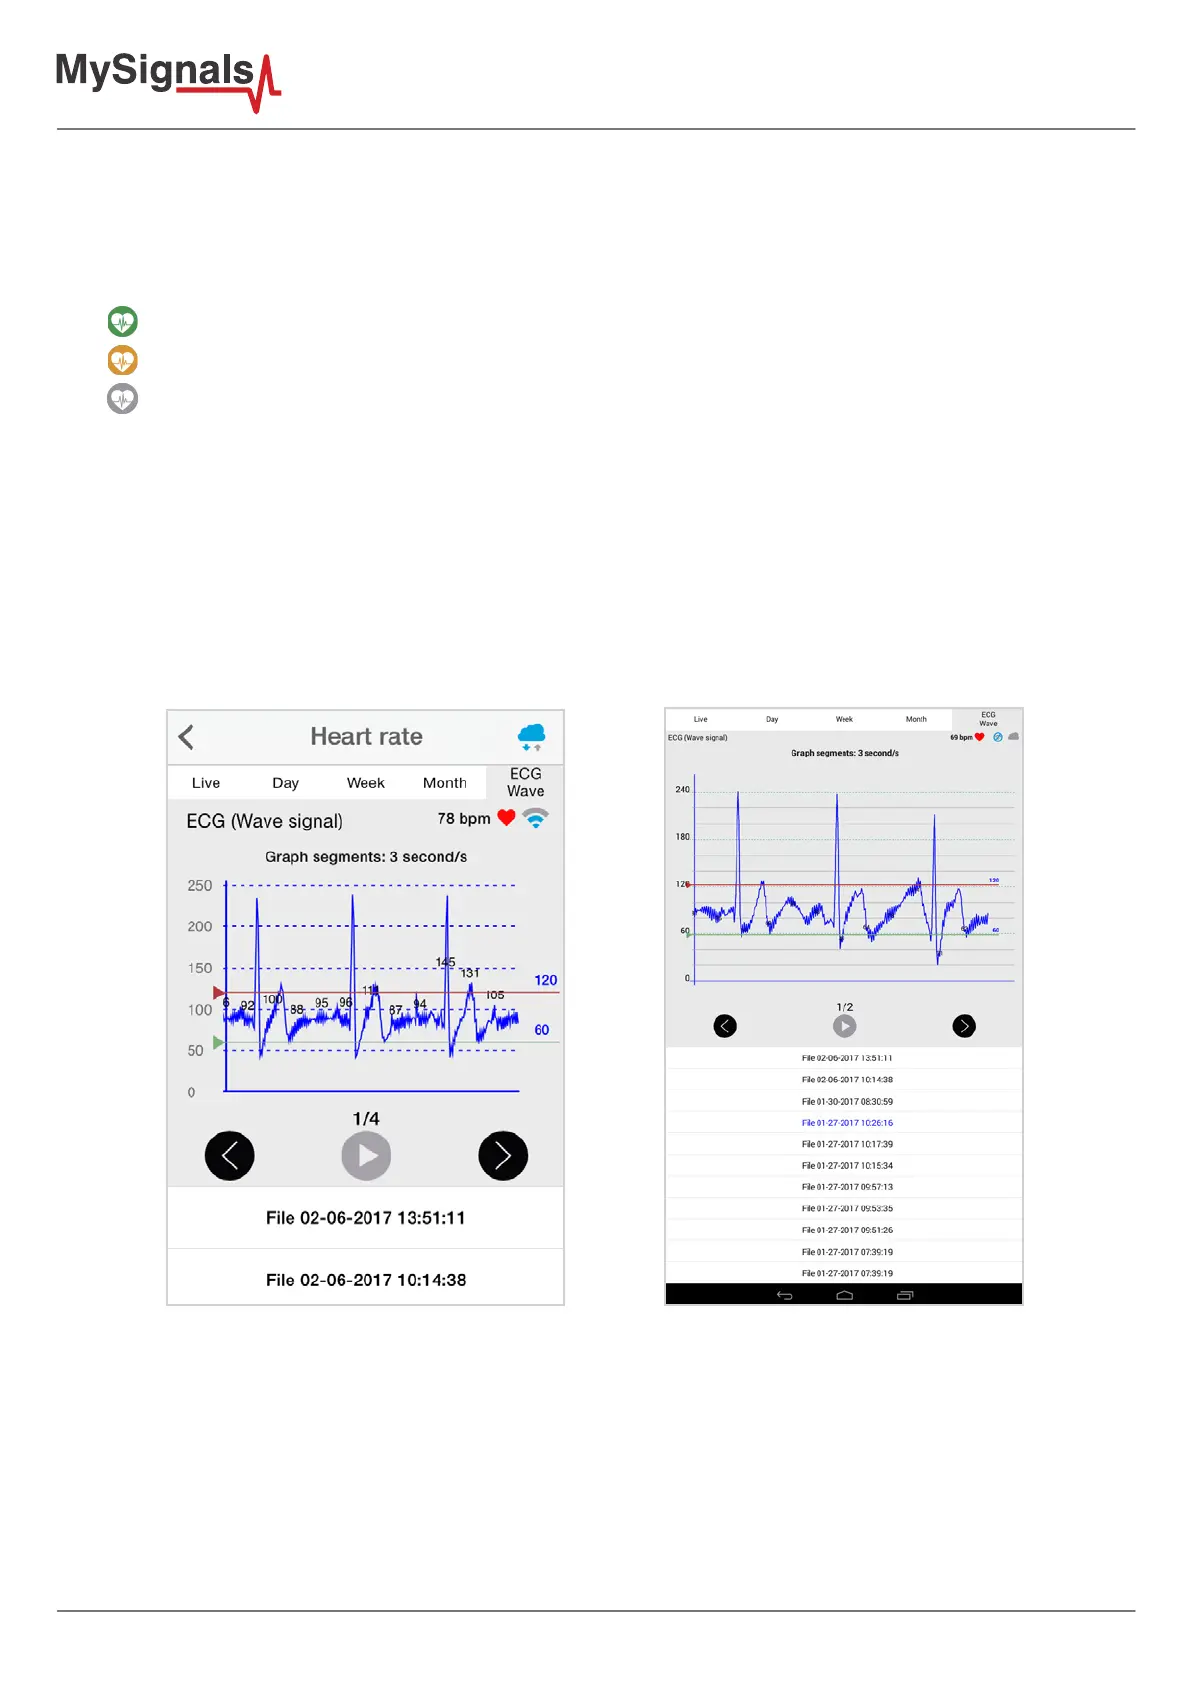
There is a new tab on detail screen for ECG, EMG, Airow and Snore sensors. This tab allows the user to display
raw data recorded from MySignals device (in Server Mode). You can record until 30 seconds from MySignals
device and show the recorded data on raw data tab, this tab is placed on the top right of the screen.
On top right, you can see the ECG rate, EMG rate, Airow rate or Snore rate. Above the graph, you can see the
graph time for X axis, in this case the graph was divided in windows of parts of 3 seconds each.
Over the graph you can notice the values for each important data peak, you can track wave changes by watching
these values.
You can move the limits of the graph with the green and red lines, touch each line to move it along the graph view.