-50- v2.9
Data Access
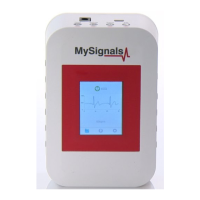
On bottom section from the graph view the are three buttons:
Right and left arrow buttons lets you move the graph to right or left. In the middle position, there is a play/pause
button to start or stop the carousel mode. By default and once the graph load ends, the graph animation plays
automatically. For instance, if you record 30 seconds on MySignals device, the application will show 11 parts to
navigate using the left/right arrow buttons. Once the graph ends loading, the animation will play automatically.
Just above the play/pause button, you can see a little navigation legend to know which part of the full graph you
are showing.
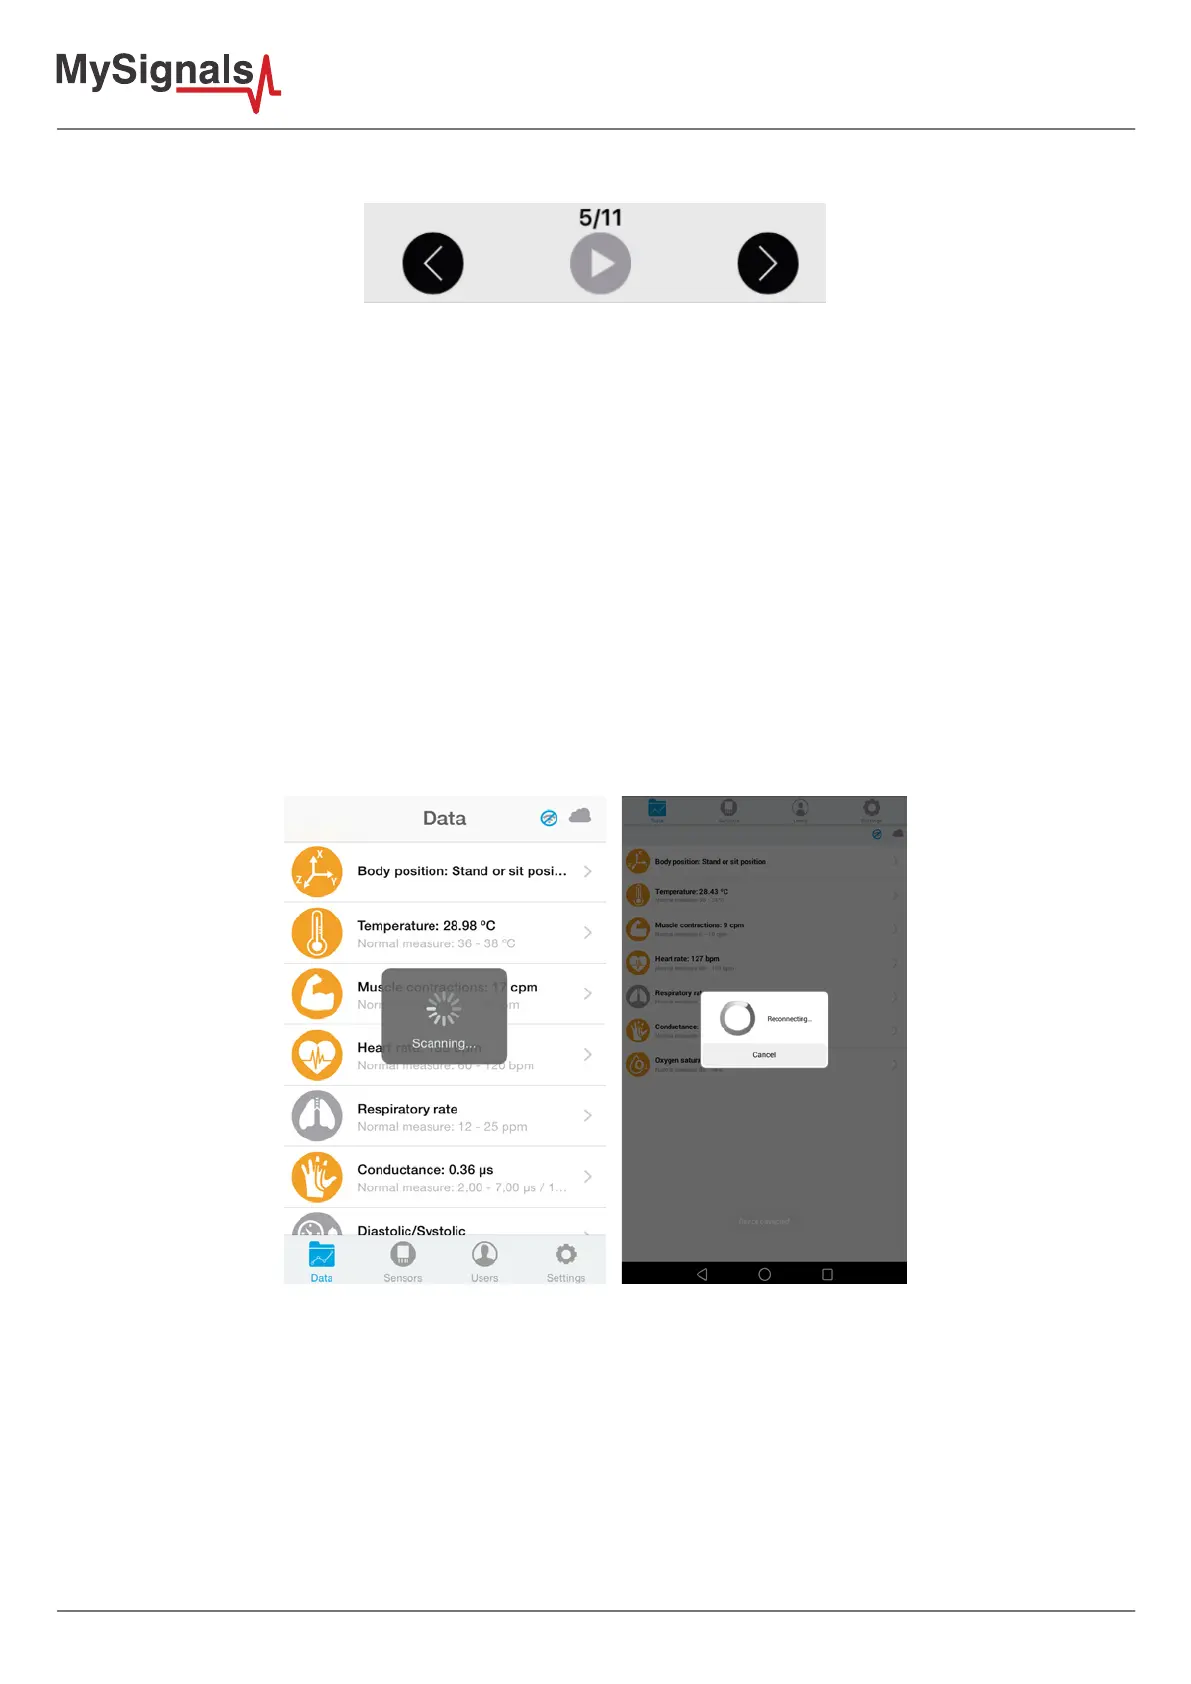
At the end of the screen you can get the list of MySignals recordings provided by the user from the device, this
listing is shown in order from latest to oldest one, each row shows the recording date and time. Tap on one row
to select a single recording and the mobile application will start plotting the data on the graph, the row will be also
highlighted to let the user know which row is currently plotting.
The listing rows have a sampling rate and it is about 10 milliseconds.
When the MySignals device establish a pairing with the application it send information in Datagram mode by
default.
Once you have completed your selection you must click on “Data” button, which you can nd at the left end of the
bottom toolbar.
Figure: Connecting